Strengths: You handle diagrams confidently (tariff, PPC, AD-AS), and Essay 2 is your strongest section — especially the idea that CA requires a gentler opportunity-cost gradient than rivals, plus a clear short-run-only view of protectionism.
Priority next steps:
CSQ extract discipline: In (a)(ii) keep X and M the right way round; in (c) let Extract 6 drive R1 (CA) and use non-CA extract evidence for R2; in (d) hunt SSP from the case — depreciation is not the best US alternative under the impossible trinity.
Essay 3(b): When the preamble says "uncertainty and instability", name recent events (US-China trade tensions, political instability, wars) before you run AD/AS.
(b)(ii) wages: More output per worker → firms compete for that labour → higher wages (no MRP).
Scan the Cherlock QR on your shared script if you want to ask why a part was cut and how to rewrite it.
CSQ
16/30 · Pages 1, 2, 3, 5, 6
CSQ — marks
Pages 1, 2, 3, 5, 6
16 / 30
Question (a)
1/4
CSQ 1(a)(i) Trade balance trend1/2
Deficit identified (M>X), but trend mark lost: you said the trade balance "increased" while remaining negative. For this 2m item: 1m = state (deficit), 1m = trend (worsening).
CSQ 1(a)(ii) Factor for trend0/2
Mechanism reversed: buying more overseas-made goods raises import expenditure (M), which worsens BOT. Use Extract 4; any valid extract-based reason for a worsening BOT is accepted.
Question (b)
6/8
CSQ 1(b)(i) Concern with trade balance3/4
AD↓ → reverse multiplier → unemployment with AD-AS is strong. Slightly overloaded with appreciation/MLC detail relative to the concern chain.
CSQ 1(b)(ii) Automation winners and losers3/4
Both winners and losers present. Winners: more output per unit labour → higher wages is on track; strengthen by saying firms compete to hire more productive labour (do not use MRP).
Question (c)
4/8
CSQ 1(c) R1: CA explains pattern change1/3
R1 should show how Singapore's BOT/pattern change is explained by CA (e.g. pharma CA in Extract 6). Early claim that electronics exports rose conflicts with the extract and weakens the CA thesis.
CSQ 1(c) R2: Limits / other factors2/3
Trade-war / China plunge is the right non-CA antithesis. Tighten the data-to-mechanism link so R2 clearly shows BOT changes from reasons not associated with CA.
CSQ 1(c) Conclusion1/2
Limited-extent stance present; need a clearer weigh-up of what was traded (CA) versus who Singapore traded with (non-CA).
Question (d)
5/10
CSQ 1(d) R1: Tariffs + eval3/4
Tariff diagram + PED + retaliation eval usable. Keep focusing on extract evidence for unintended consequences.
CSQ 1(d) R2: Alternative + eval1/4
Depreciation can improve BOT in theory, but it is not the best US alternative: with free capital flows and interest-rate targeting, the US cannot freely manage the exchange rate (impossible trinity). Prefer supply-side policies hunted from the case evidence.
CSQ 1(d) Conclusion1/2
Correct that tariffs are not best, but preferring depreciation is the wrong final call for the US. Conclude toward SSP / competitiveness from the case.
CSQ — question & answer by part
Coloured highlights mark issues; curved lines link each one to its comment (desktop). Green = correct, amber = partial, red = incorrect.
Question 1(a)(i) · [2]
With reference to Table 1, summarise the trend in the US trade balance between 2014 and 2018.
1/2
Page 1
CSQ 1(a)(i) Trade balance trend1/2
(a)(i)
The trade balance refers to the difference between value of total value of export revenue (X) and the total value of import expenditure (M).✓ (X-M). From 2014 to 2018, the magnitude of X-M faced an overall increase, which indicates that the trade balance increased(1). while the sign of the trade balance remained negative as M > X which signifies that import expenditure is greater than export revenue.✓ However, in 2017, there was an increase in the trade balance which is an anomalous data.✓
1PartialUnclear Trendp.1
(a)(i) Wording issue
For this 2m item: 1m for identifying the deficit, 1m for saying it worsened. You have the deficit (M>X), but "trade balance increased" muddies the trend mark.
the magnitude of X-M faced an overall increase, which indicates that the trade balance increased
What to do next: State clearly: the US was in a trade deficit, and the deficit worsened from 2014 to 2018 (with optional anomaly).
Question 1(a)(ii) · [2]
Explain one possible factor that might account for the trend.
0/2
Page 1
CSQ 1(a)(ii) Factor for trend0/2
(ii)
From extract 9, it states that people in the US have been buying more manufactured products but these products are increasingly made overseas where cost of production is lower.✓ Hence the change in consumer tastes and preferences led to an increase in demand for exports from other countries, which led to an increase in export revenue(2). This thus leads to the balance of trade (X-M) improving.✓
2IncorrectKnowledge Errorp.1
(a)(ii) Reversed mechanism
You used the extract idea, but reversed X and M: overseas manufacturing raises US import expenditure, so BOT worsens — it does not raise US export revenue.
led to an increase in demand for exports from other countries, which led to an increase in export revenue
What to do next: Hunt the extract reason, then finish with the BOT worsening direction. Any valid extract-based worsening story is accepted.
Question 1(b)(i) · [4]
With reference to Extract 4, explain why the US is concerned with its trade balance.
3/4
Page 1
CSQ 1(b)(i) Concern with trade balance3/4
(b)(i)
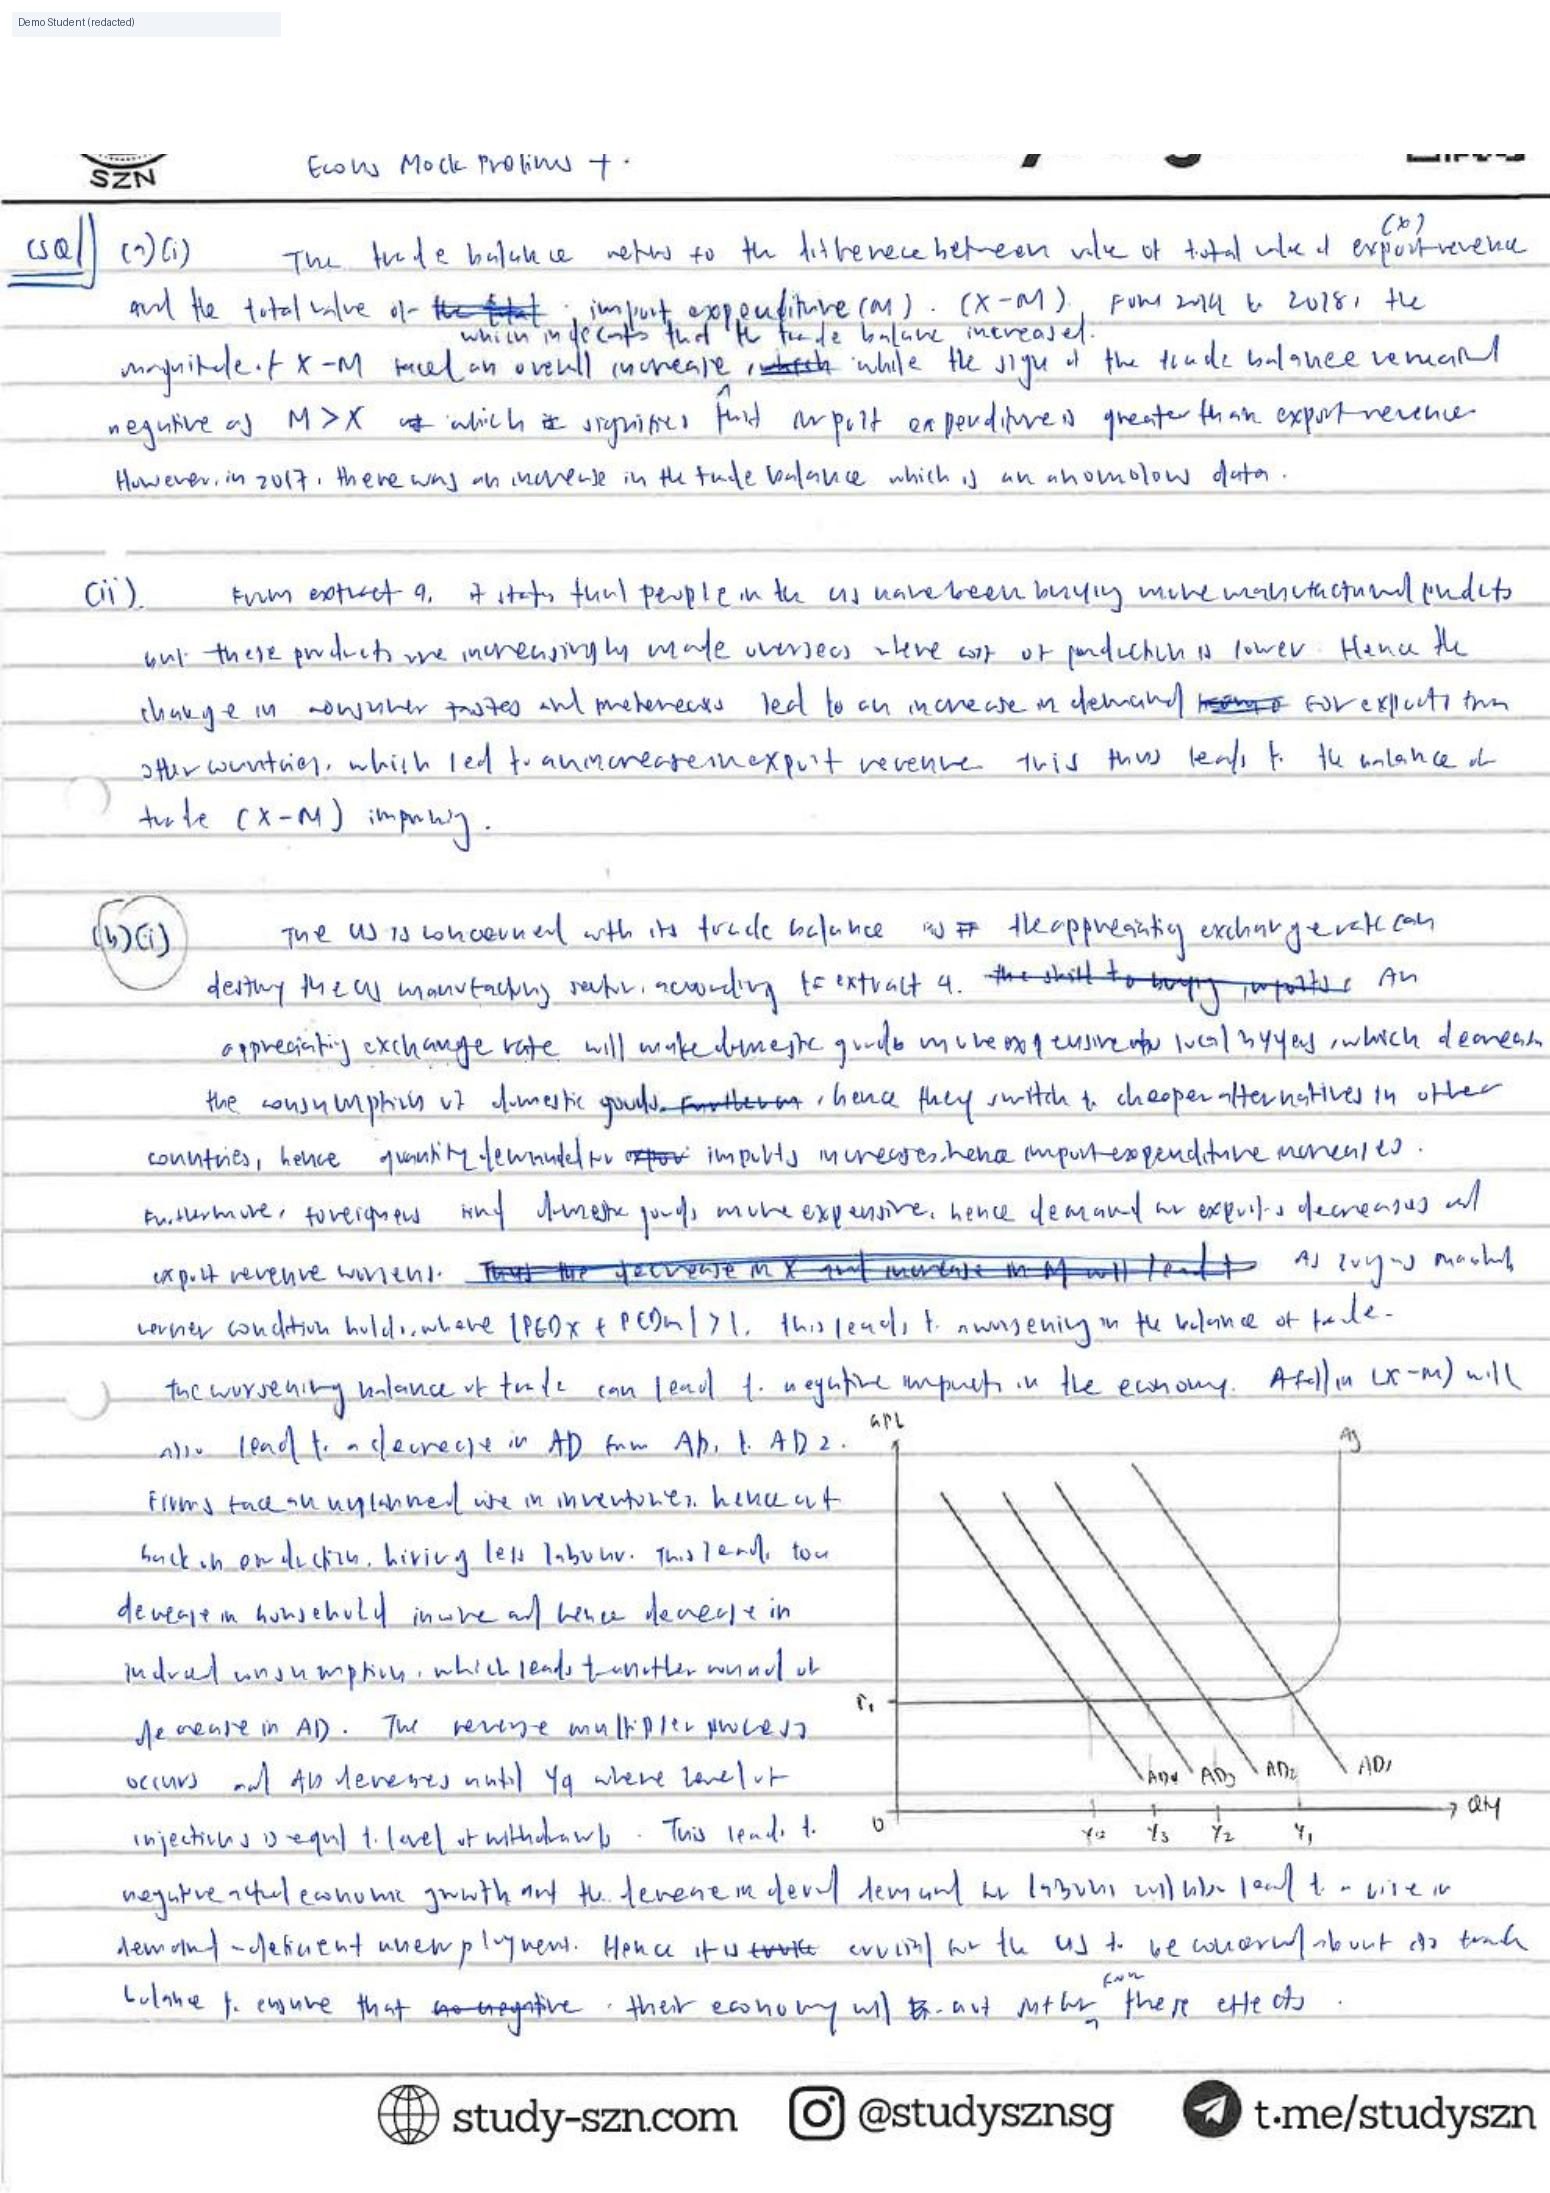
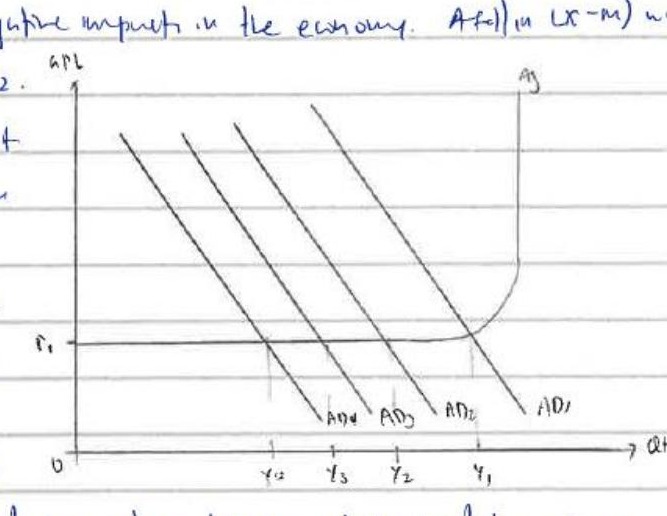
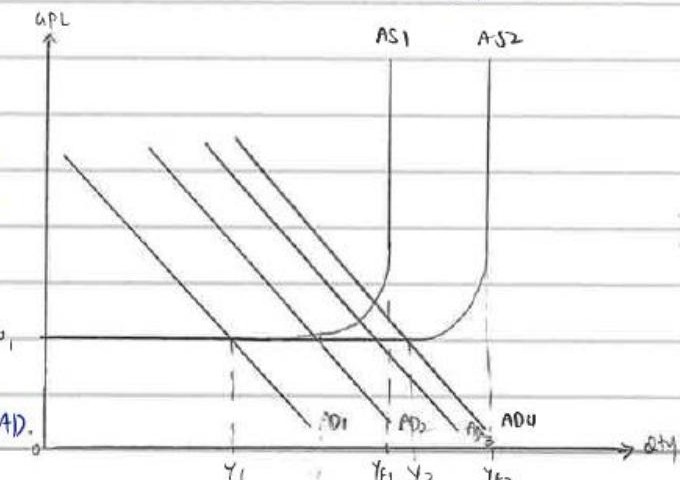
The US is concerned with its trade balance as the appreciating exchange rate can destroy the US manufacturing sector.✓ According to extract 4, an appreciating exchange rate will make domestic goods more expensive for local buyers, which decreases the consumption of domestic goods.✓ hence they switch to cheaper alternatives in other countries, hence quantity demanded for imports increases, hence import expenditure increases.✓ Furthermore, foreigners find domestic goods more expensive, hence demand for exports decreases and export revenue worsens.✓ As long as Marshall-Lerner condition holds, where |PEDx + PEDm| > 1, this leads to a worsening in the balance of trade.✓ The worsening balance of trade can lead to negative impacts in the economy.✓ A fall in (X-M) will also lead to a decrease in AD from AD1 to AD2.✓
Firms face an unplanned rise in inventories, hence cut back on production, hiring less labour.✓ This leads to a decrease in household income and hence decrease in induced consumption, which leads to another round of decrease in AD.✓ The reverse multiplier process occurs and AD decreases until Yq where level of injections is equal to level of withdrawals.✓ This leads to negative actual economic growth and the decrease in derived demand for labour will also lead to a rise in demand-deficient unemployment.(3) Hence it is crucial for the US to be concerned about its trade balance to ensure that their economy will not suffer these effects.✓
This leads to negative actual economic growth and the decrease in derived demand for labour will also lead to a rise in demand-deficient unemployment.
4CorrectDiagramp.1
(b)(i) AD-AS diagram
AD1→AD2 with GPL / real income axes supports the concern story.
Aggregate Demand and Supply (AD-AS) model graph showing shifts in AD curves.
Question 1(b)(ii) · [4]
Explain the statement "Automation has created winners and losers."
3/4
Page 2
CSQ 1(b)(ii) Automation winners and losers3/4
Automation has created winners through technologically-driven innovation which makes workers more productive, hence more output per unit of labour would translate to an increase in wages(5). This benefits workers as their real wages increase; hence purchasing power increases, which leads to higher material standard of living.✓
Automation has also created losers in the form of increased structural unemployment and increased resistance to innovation and automation amongst workers.✓ The integration of automation into industries may lead to workers being not required due to more efficient and cheaper automation alternatives.✓ Hence the failure to provide workers with skills and assistance to move to new jobs or occupations will lead to more workers being laid off and being unable to find jobs.✓ This will cultivate a greater sense of aversion to developments in technology which will further worsen the economy in the long run.✓
5Partialp.2
(b)(ii) Winners and losers
Winners and losers both present. Preferred winners story (no MRP): more output per unit input → firms compete to hire that labour → higher wages.
technologically-driven innovation which makes workers more productive, hence more output per unit of labour would translate to an increase in wages
What to do next: Add the firm-competition step for wages instead of jumping straight from productivity to wages.
Question 1(c) · [8]
Assess how far the concept of comparative advantage can help to explain the changes in Singapore's patterns of trade as described in Extract 6.
4/8
Pages 2–3
CSQ 1(c) R1: CA explains pattern change1/3
CSQ 1(c) R2: Limits / other factors2/3
CSQ 1(c) Conclusion1/2
A country has a comparative advantage in the production of a good when it can produce the good at a lower opportunity cost than its trading partners.✓ The theory of comparative advantage states that trade can benefit all countries if each specialises in producing and exporting the good in which it has a comparative advantage in, and imports the good in which it has a comparative disadvantage in.✓
The changes in Singapore's pattern of trade can be explained by the concept of comparative advantage, as seen by the increase in Singapore's exports of electronics and pharmaceuticals(6). Initially, from extract 5, Singapore held a comparative advantage for the production of electronics, especially to countries such as the US and European Union.✓ Since Singapore may have more advanced facilities and resources due to increased investment and research and development, they will be able to produce electronics at lower opportunity cost than other countries.✓ Thus increased US and European Union demand for Singapore exports will lead to an increase in export revenue in the market for electronics.✓ Extract 6 states that "Southeast Asia would reap a windfall from the shift in trade and investment", which suggests that the export revenue increased significantly.✓ Furthermore, the decline in shipments of electronics was offset by stronger shipments of pharmaceuticals, as Singapore's pharmaceutical industry is on the rise.✓ Hence the pharmaceutical industry will become more efficient and productive, which decreases the opportunity cost to produce the next unit of good, which then led to Singapore gaining comparative advantage in the export of pharmaceuticals.✓ Hence as export of electronics will face a decline eventually due to smaller consumer base, the rise of the pharmaceutical industry will offset this to a certain extent.✓
The concept of comparative advantage can only explain the changes to Singapore's pattern of trade to a certain extent, as it does not take into account the other external factors that led to an increase in their decrease in their exports for electronics.✓ This was due to disruptions caused by the trade war between Washington and Beijing(7). The US imposing tariffs on China led to China retaliating and decreasing imports from other countries, including Singapore.✓ This led to exports with China plunging 17.✓5% and hence other external factors led to a decrease in Singapore exports to China, South Korea, Taiwan, Japan and Hong Kong.✓ The US also placed tariffs on steel and aluminium tariffs to all countries globally.✓ Foreign goods will become more expensive in the US, and thus quantity demanded for exports will decrease.✓ This leads to a 'beggar-thy-neighbor' effect, as a decrease in exports of a foreign country's goods will lead to a decrease in AD which leads to a decrease in AD, and hence real national income this leads to a decrease in demand for imports as purchasing power of consumers in the foreign country decreased as prices of imported goods increased.✓ If these countries that trade with US are affected, then they will produce less to sell less to the US and hence demand lower SG exports which ultimately reduces Singapore export revenue and AD.✓
In conclusion, the concept of comparative advantage can only help explain the changes in Singapore's pattern of trade to a limited extent(8), as it only focuses on the opportunity cost in Singapore's perspective which can lead to an increase in exports of pharmaceuticals and electronics, but it fails to consider the hindering effect of exports due to external factors such as the US imposing tariffs on global economies. Hence a more rounded approach which covers different perspectives would be more reliable.✓
6PartialExtract Misusep.2
(c) Electronics claim
R1 should explain Singapore's BOT/pattern change via CA (e.g. pharma). Claiming electronics exports rose fights Extract 6.
increase in Singapore's exports of electronics and pharmaceuticals
What to do next: Use Extract 6 carefully: pharma shipments offset electronics decline via CA; do not invent an electronics export boom.
7Correctp.3
(c) Trade-war antithesis
Good non-CA antithesis (trade war / China plunge). This is exactly what R2 needs: BOT changes from reasons not associated with CA.
disruptions caused by the trade war between Washington and Beijing
What to do next: Keep R2 tightly on extract data → non-CA mechanism; avoid tangling it with a second full AD story.
8Partialp.3
(c) Conclusion
Limited-extent verdict is fine; weigh product-mix CA vs partner-demand shocks more sharply.
to a limited extent
Question 1(d) · [10]
Discuss whether tariffs is the best policy the US could adopt to address her trade imbalance.
5/10
Pages 5–6
CSQ 1(d) R1: Tariffs + eval3/4
CSQ 1(d) R2: Alternative + eval1/4
CSQ 1(d) Conclusion1/2
(d)
A tariff is a tax on imports and is one policy that the US would adopt to address her trade imbalance.✓ The US is suffering from a trade imbalance when its import expenditure is greater than its export revenue.✓
(d)
A tariff is a tax on imports and is one policy that the US could adopt to address her trade imbalance.✓ The US is suffering from a trade imbalance when its import expenditure is greater than its export revenue, hence an effective policy should either aim to decrease import expenditure or raise export revenue.✓
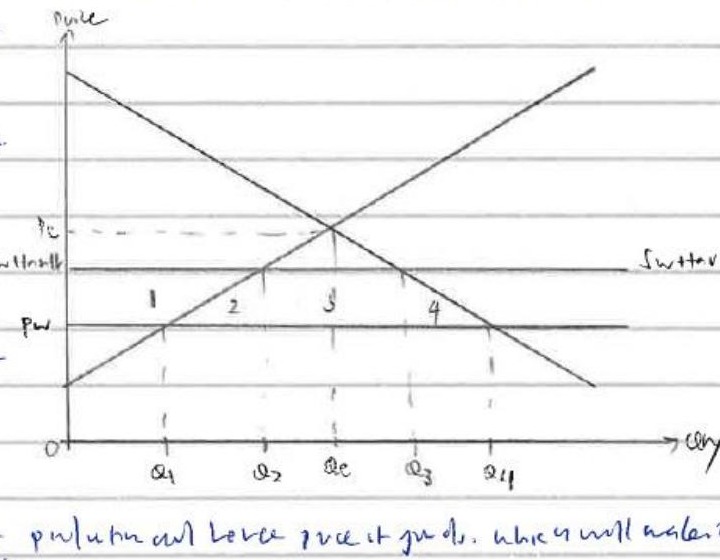
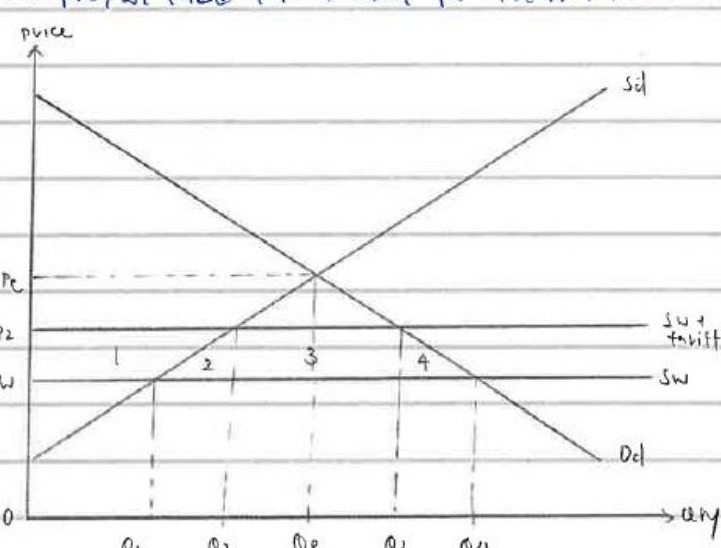
Tariffs are an effective policy that the US could adopt to address her trade imbalance.✓ When the US government imposes the tariff on steel and aluminium, this will lead to imports from other countries being more expensive in domestic terms.✓ Assuming that the demand for imports is price elastic, this would lead to a more than proportionate fall in quantity demanded for imports, which in turn causes import expenditure to decrease.✓ This will thus improve US's balance of trade.✓ Furthermore, by analysing how a tariff works, we can access how it can improve US trade imbalance in other ways.✓ This is seen in the diagram, where before the tariff is imposed, the domestic economy can import freely at the world price, Pw, with consumers consuming at Q4 while domestic producers produce at Q1 and level of imports is Q4 - Q1.✓ After a tariff is imposed, world supply curve shifts upwards to Sw + tariff, and the domestic price rises to Pworld + tariff.✓ Domestic quantity supplied is now Q2 while quantity demanded occurs at Q3, and level of imports decrease from Q4 - Q1 to Q3 - Q2.✓ The government will be able to earn a tariff revenue in the form of area 3, which is paid for by domestic consumers, which can fund more research and development to raise productivity of production processes, which decreases the unit cost of production and hence price of goods, which will make it more price competitive, hence increasing demand for exports, and hence export revenue.✓ This the decrease in import expenditure (M) and increase in export revenue will lead to an improvement in US trade balance.✓
However, such measures are purely short term and will not solve the underlying problems that lead to this trade imbalance such as loss of comparative advantage or poor quality of exports.✓ Furthermore, foreign trading partners may retaliate(9) by increasing or setting up their own import barriers, which will lead to a fall in US exports. Thus, although import expenditure may fall, there may be a corresponding fall in export revenue, which will negate the intended effect to remedy US's trade imbalance.✓
exchange rate based monetary policy in this case✓
Another policy that the US could adopt to address her trade imbalance is through depreciation.(11) When the US exchange rate depreciates, the price of exports in foreign terms becomes relatively cheaper, which leads to an increase in demand for exports and hence export revenue increases.✓ The price of imported goods in US terms becomes more expensive.✓ Assuming that the demand for imports is price elastic, this will lead to a more than proportionate fall in quantity demanded for imports, which leads to a decrease in import expenditure.✓ However, as long as the Marshall-Lerner condition holds, where PEDx + PEDm > 1, depreciation will lead to an improvement in the balance of trade.✓
To evaluate the effectiveness of exchange rate-based monetary policy, we should consider its time lag.✓ The trade balance may worsen in the short run before improving in the long run, as the demand for exports and imports may be price inelastic and well as the demand for imports, before it becomes more elastic with time.✓ Hence the BOT may worsen in the short-run before improving.✓
In conclusion, tariffs are not the best policy that the US could adopt(12) to address her trade imbalance as they bring about several unintended consequences such as deadweight loss, as well as the threat of retaliation by trading partners. Hence the US government should most consider other policies such as depreciation as more suitable alternatives to better address the trade imbalance.✓
9Correctp.5
(d) Retaliation
Short-run only + retaliation risk is good eval against tariffs.
foreign trading partners may retaliate
10CorrectDiagramp.5
(d) Tariff diagram
Price/Qty, Sw+tariff, Q1–Q4 present. Keep area labels consistent with DWL (production vs consumption triangles).
Economic supply and demand graph showing the impact of a tariff on price and quantity, including world price (Pw), tariff price (Sw+tariff), and quantity levels (Q1, Q2, Qe, Q3, Q4
11Incorrectp.6
(d) Depreciation not best for US
Depreciation can improve BOT in theory, but for the US it is not the best alternative. With free capital flows and interest-rate control, the US cannot freely manage the exchange rate (impossible trinity). Prefer SSP from the case.
Another policy that the US could adopt to address her trade imbalance is through depreciation.
What to do next: In CSQ (d), hunt SSP / competitiveness points in the extracts as your main alternative; treat depreciation as conceptually possible but policy-infeasible for the US.
12Partialp.6
(d) Verdict
Tariffs are rightly not best, but ending on depreciation is the wrong preferred alternative for the US.
tariffs are not the best policy that the US could adopt
What to do next: Conclude: tariffs not best; SSP targeting competitiveness (from case evidence) is better than FX management for the US.
Essay 1
21/25 · Pages 7–10
Essay 1 — marks
Pages 7–10
21 / 25
E2(a) Introduction CA1/1
OC definition and drivers signalled.
E2(a) R1: Endowments / productivity → CA4/4
PPC gradient = OC, and you correctly require OC to become lower than trading partners to gain CA. Good contextual goods (shoes vs high-end tech).
E2(a) R2: Policy / tech / depletion4/5
SSP/R&D gentler PPC + Brunei depletion chains complete and contextualised.
E2(b) Introduction protectionism1/1
Defines protectionism and frames extent.
E2(b) R1: Infant / anti-dumping4/5
Infant industry + LRAC/MES + anti-dumping with perpetual-infant eval.
E2(b) R2: Costs / retaliation4/5
Tariff DWL + retaliation AD↓ — strong.
E2(b) Conclusion3/4
Good: protectionism only limited/temporary, prefer SSP. Make the long-run verdict sharper — protectionism generally cannot be justified as a long-run policy.
Essay 1 — question & answer by part
Coloured highlights mark issues; curved lines link each one to its comment (desktop). Green = correct, amber = partial, red = incorrect.
Question 2(a) · [10]
Explain possible reasons why an economy's comparative advantage might change over time.
9/10
Pages 7–8
E2(a) Introduction CA1/1
E2(a) R1: Endowments / productivity → CA4/4
E2(a) R2: Policy / tech / depletion4/5
Q 2(a)
Explain possible reasons why an economy's comparative advantage might change over time. (10)
The theory of comparative advantage states that trade can benefit all countries if each specialises in producing and exporting the good in which it has a comparative advantage (lower opportunity cost), and import the goods in which it has a comparative disadvantage (higher opportunity cost).✓ An economy's comparative advantage may change over time due to supply side government policies and changes in the quality and quantity of factor endowments(1) that affect the opportunity cost of producing the good. A loss of comparative advantage can be due to depletion of natural resources or other countries gaining a comparative advantage of producing a certain good.✓
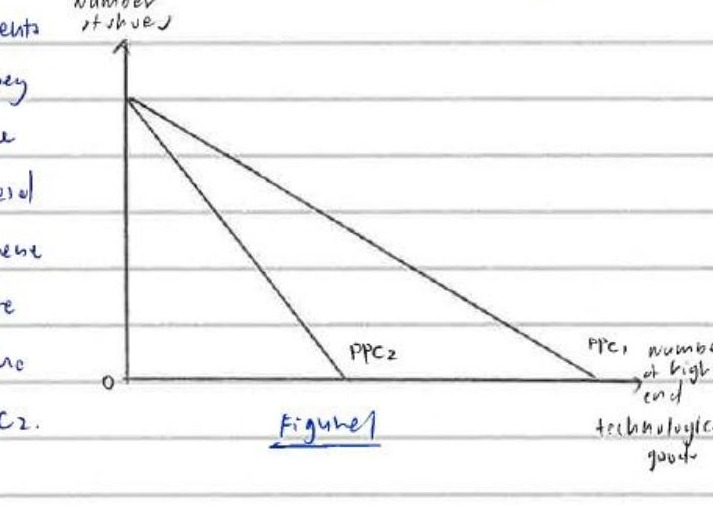
The comparative advantage of a country may change over time due to changes in the quantity and quality of its factor endowments which affect the relative opportunity costs of producing a good.✓ When worker productivity decreases or when capital becomes less efficient, this leads to a decrease in productivity, leading to more resources required to produce each additional unit of good.✓ This leads to higher opportunity cost of production as more goods that could have been produced are now forgone.✓ On the PPC (production possibility curve), the gradient represents the opportunity cost of the x-axis good, in this case being the number of high-end technological goods produced.✓ Hence when a country loses comparative advantage due to decreased quality of capital and labour as well as the potential decrease in labour during a recession when workers are laid off, the opportunity cost increases as seen by the gradient of the PPC becoming steeper from PPC1 to PPC2.✓
The comparative advantage of a country may also change over time due to government policies and technological advancement, that raise the productivity of factors of production, hence lowering opportunity cost.✓ Supply side policies such as provision of skills upgrading and education, as well as subsidies and investments to stimulate research and development will lead to an increase in the quantity and quality of factors of production, and higher labour productivity.✓ This means that fewer units of shoes will be forgone for additional unit of high end technological goods produced, and hence opportunity cost falls.✓ The PPC shifts asymmetrically from PPC2 to PPC1 as seen in the diagram in Figure 1.✓ The gradient of the PPC becomes gentler, and if the new opportunity cost is lower than that of its trading partners, a country will gain comparative advantage in the production of high end technological goods.✓
An economy's comparative advantage may also change over time due to limited natural resources.✓ A country that initially has a comparative advantage due to an abundance of natural resources such as oil, rubber or timber will see its opportunity cost rise due to depletion of natural resources.✓ This is evident in Brunei initially had a comparative advantage in the oil and gas industry(3). However overtime, as these resources were exhausted, its opportunity cost will rise due to more resources such as capital and labour being needed to extract the remaining supply, such as drilling deeper or extracting from untouched areas.✓ Hence as more resources are required to produce each additional unit of good, the production of other goods is sacrificed.✓ Hence opportunity cost increases.✓ As this increase in cost exceeds the price of other economies, the economy will lose its comparative advantage.✓
1Correctp.7
E2(a) start
Strong start: define CA via OC. Remember a country gains CA only when its PPC gradient becomes gentler than a rival's.
An economy's comparative advantage may change over time due to supply side government policies and changes in the quality and quantity of factor endowments
What to do next: Keep stating the rival comparison explicitly whenever gradient changes.
2CorrectDiagramp.7
E2(a) PPC gradient
PPC contextualised to shoes vs high-end tech, and you link gentler gradient vs trading partners to gaining CA.
Production Possibility Curve (PPC) graph showing a shift from PPC1 to PPC2 with axes labeled 'Number of shoes' and 'Number of high-end technological goods'.
What to do next: Keep diagrams always labelled with your chosen goods so the OC story stays contextual.
3Correctp.8
E2(a) Brunei depletion
Resource depletion → OC↑ → lose CA is a complete endowment chain.
Brunei initially had a comparative advantage in the oil and gas industry
Question 2(b) · [15]
Discuss whether, on balance, the use of protectionist policies can ever be justified.
12/15
Pages 8–10
E2(b) Introduction protectionism1/1
E2(b) R1: Infant / anti-dumping4/5
E2(b) R2: Costs / retaliation4/5
E2(b) Conclusion3/4
Discuss whether, on balance, the use of protectionist policies can ever be justified. [15]
Protectionism refers to government policies that restrict international trade in order to protect domestic industries from foreign competition.✓ Countries may adopt protectionist policies for several reasons, such as to protect jobs, grow new industries, or to secure supply chains for national security, or to fight unfair trade practices like dumping.✓ Protectionist policies are only justified to a certain extent as they have both benefits and costs.✓
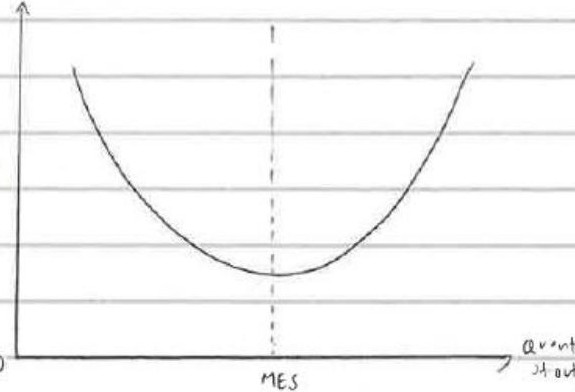
Protectionist policies can be justified to a certain extent, which is only in the short run.✓ This can be argued through the infant industry argument, and anti-dumping argument.✓ An infant industry is a new industry that has not yet achieved internal economies of scale (IEOS).✓ Its long run average cost (LRAC) is still high because it has not reached its minimum efficient scale (MES), hence it cannot compete against more dominant firms that already have low costs.✓ Temporary protection through tariffs or quotas shields an infant industry from foreign competition(4), allowing it to grow bigger and reap IEOS. This can be achieved through technological economies through specialisation and division of labour which increases labour productivity and decreases unit cost of production.✓ The LRAC moves towards MES.✓ Once its costs are low enough to compete against foreign firms, protectionism can be removed.✓ Furthermore protectionist policies are efficient to counter dumping.✓ Dumping occurs when a foreign firm sells exports below its marginal cost of production.✓Anti-dumping tariffs are✓
imposed to cancel out the artificially low price and restore fair competition.✓ Unlike most protectionism, anti-dumping measures respond to a foreign distortion, specifically predatory pricing or foreign subsidies, that harms domestic producers unfairly.✓ The WTO allows anti-dumping action when dumping is proven and a domestic industry is negatively affected.✓ These policies should always be removed once foreign pricing returns to normal.✓
However, both arguments come with limitations.✓ The infant industry argument brings about the risk of "perpetually infant" problem(6), as once protected, a firm lobbies to keep protectionism forever, and protectionism becomes permanent. This leads to firms becoming complacent and less productive, raising unit costs of production, and this leads to a loss in comparative advantage.✓ Anti-dumping is also hard to prove in practice.✓ Many anti-dumping cases lack proper evidence and are in fact just disguised protectionism.✓For large economies, these [crossed out: weaknesses] are [crossed out: quite significant]✓
Protectionist policies can also [crossed out: be justified] not be justified as it leads to negative impacts on an economy, in the form of welfare loss.✓ For example, we take into account the effect of a tariff.✓ When a tariff is imposed, two areas of deadweight loss, area 2 and 4 are created.✓ Area 2 is the production inefficiency loss, where domestic firms are inefficient at producing a good compared to foreign firms, hence producing at higher costs, wasting resources.✓ Area 4 is the consumption inefficiency loss, where consumers who would have bought at the world price Pw are priced out.✓ Resources shift away from industries where the country has comparative advantage in towards less efficient protected industries, causing allocative inefficiency.✓
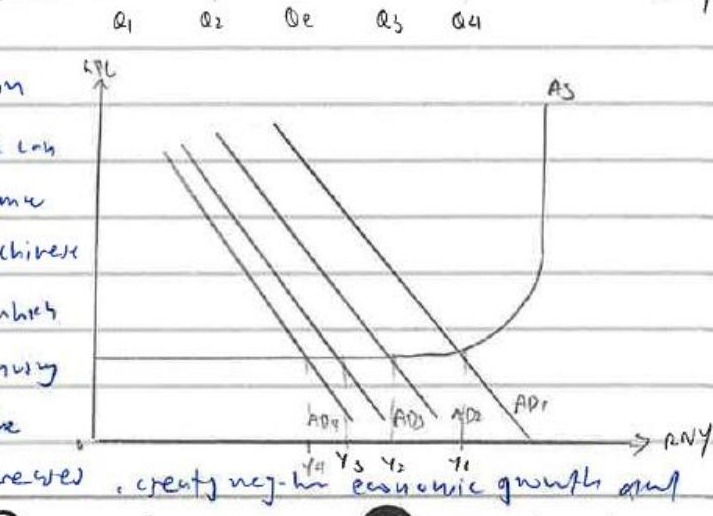
Furthermore, protectionism can also lead to retaliation from trading partners, which can stop a country from reaching its own macroeconomic goals.✓ For example when the US imposes tariffs on Chinese imports, China retaliates with tariffs on US exports, which decreases the exports and hence export revenue, causing (X-M) to decrease and hence AD decrease.✓Through the reverse multiplier effect, real output income decreases, creating negative economic growth and✓
increases demand-deficient unemployment.✓ This creates a negative effect of protectionism.✓
These negative effects are worse for larger economies as they trade at greater volumes which leads to even greater welfare losses.✓ Furthermore [?✓] large economies such as China and US are more vulnerable to retaliation by their trading partners.✓ Trade wars between these large economies will also hurt the rest of the world by disrupting supply chains and reducing global trade.✓
In conclusion, the use of protectionist policies is only justified to a limited extent(9), as they even in the short run they lead to welfare loss and in the long run they bring about more negative effects as seen by the infant industry argument and anti-dumping argument. These negative effects including deadweight losses, retaliation that decreases AD and more competition build up over time and worsen the state of economy.✓ However, in the short run protectionism can be justified as they provide protect infant industries from more dominant competitors until it reaches MES, as well as responding to dumping.✓ Ultimately, the use of protectionist policies should not be the first option for governments due to these effects, but rather they should consider using supply-side policies.✓
4Correctp.8
E2(b) Infant industry
Infant industry + IEOS/MES path is the right justification.
Temporary protection through tariffs or quotas shields an infant industry from foreign competition
5CorrectDiagramp.8
E2(b) LRAC / MES
LRAC falling toward MES illustrates the infant-industry scale story.
Economic graph showing a Long Run Average Cost (LRAC) curve with axes for cost and quantity of output, indicating the Minimum Efficient Scale (MES)
6Correctp.9
E2(b) Perpetual infant
Perpetual infant + anti-dumping proof problems are strong FIRST eval.
risk of "perpetually infant" problem
7CorrectDiagramp.9
E2(b) Tariff DWL
Areas 2 and 4 as production/consumption DWL with Sw and Sw+tariff — strong.
Supply and demand graph showing the welfare effects of a tariff, including deadweight loss areas 2 and 4.
8CorrectDiagramp.9
E2(b) Retaliation AD-AS
Leftward AD shifts support the retaliation / negative growth point.
Aggregate Demand and Aggregate Supply (AD-AS) model showing a leftward shift in AD curves.
9Partialp.10
E2(b) Conclusion
You treat protectionism as limited/temporary and prefer SSP — good. Push the long-run line harder: generally cannot be justified as a long-run policy.
the use of protectionist policies is only justified to a limited extent
What to do next: End with: generally unjustified in the long run; temporary only in select cases (infant industry with sunset / dumping).
Essay 2
15/25 · Pages 11–14
Essay 2 — marks
Pages 11–14
15 / 25
E3(a) Introduction globalisation1/1
Defines globalisation; names two factors.
E3(a) R1: Trade liberalisation / CA4/4
CA → CPC gains → FTA incentive with diagrams.
E3(a) R2: ICT / transport4/5
ICT + containerisation clear. Strengthen transport: previously high transport costs fully eroded gains from trade in some industries; after tech cut costs, mutually beneficial trade became viable again.
E3(b) R1: Positive impact on SG2/4
Generic globalisation → FDI/X → AD+AS is thin for "current" developments. Anchor positives in recent context (e.g. safe-haven FDI amid US-China tensions / instability).
E3(b) R2: Negative impact on SG2/4
Supply-chain cost-push risk is usable, but "uncertainty and instability" must be tied to recent events (US-China trade tensions, political instability, wars such as Russia-Ukraine / US-Iran).
E3(b) Evaluation / weighing1/4
Small-k / trade reliance eval present but overlaps R1/R2; needs recent-event specificity to weigh extent.
E3(b) Conclusion1/3
Net long-run positive stance OK, but without named recent events the argument stays too vague for a strong (b).
Essay 2 — question & answer by part
Coloured highlights mark issues; curved lines link each one to its comment (desktop). Green = correct, amber = partial, red = incorrect.
Question 3(a) · [10]
Globalisation has been a major influence on Singapore's economic performance. The uncertainty and instability happening around the world in recent years could threaten the economic benefits that globalisation brings.
Explain two different factors that have enabled globalisation to occur.
9/10
Page 11
E3(a) Introduction globalisation1/1
E3(a) R1: Trade liberalisation / CA4/4
E3(a) R2: ICT / transport4/5
Globalisation refers to the growing integration of economies around the world through cross-border flows of trade in goods and services, FDI, capital and labour.✓ This essay will explain two relevant factors that enabled globalisation to occur, which includes technological advances and increasing liberalisation in trade, capital and labour markets(1).
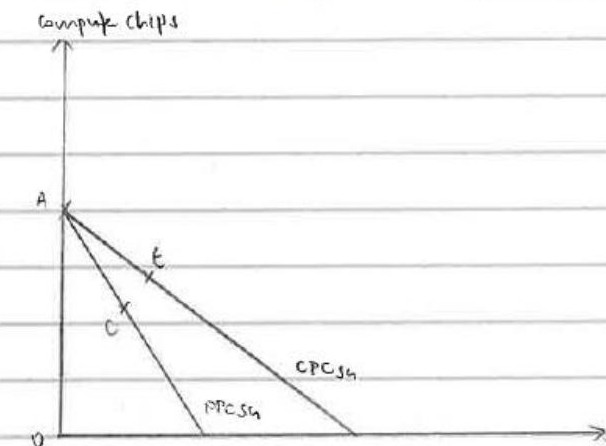
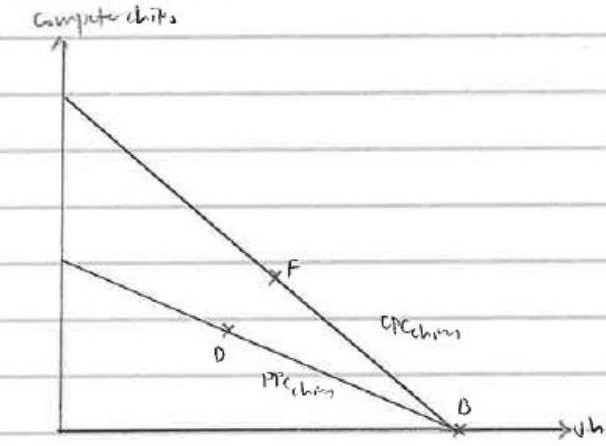
One factor that enabled globalisation to occur is due to trade liberalisation based on the theory of comparative advantage, which gives countries strong incentives to reduce trade barriers and integrate economically.✓ For A country has comparative advantage in a good when it produces that good at a lower opportunity cost than its trading partners.✓ According to the law of comparative advantage, when countries specialise in goods with low opportunity cost and trade at mutually beneficial terms of trade, both can consume on the consumption possibility curve (CPC) outside their own PPC.✓
As shown in the diagram above, the chance to consume beyond PPC gives governments a strong reason to remove trade barriers.✓ The deeper PPC This incentivises the formation of free trade agreements (FTAs), which are binding agreements between 2 or more countries to reduce or remove tariffs, quotas or other trade barriers.✓ This is evident in Thailand and Singapore where Thailand holds the comparative advantage in the production of rice while Singapore holds CA in electronics and high-value manufacturing through its skilled labour and capital.✓ Through specialisation and trade, both economies use their differences in opportunity costs to consume beyond their own PPCs.✓ The spread of FTAs will hence cut trade barriers worldwide and lead to an increase in globalisation.✓
Another factor that enables globalisation to occur is through developments in ICT and reductions in transport costs.✓ These factors reduce the costs of coordinating international production and trade, hence stimulating globalisation.✓ Developments in information and communications technology(2), such as video conferencing, emails and project management software allows firms to
coordinate in real time across locations globally.✓ This cuts coordination costs, allowing MNCs to disaggregate production, which is to split up the production of a good to multiple countries by outsourcing or offshoring production.✓ Each stage generates flows of intermediate goods, capital and technology across borders.✓ These flows will then increase cross border activity and hence globalisation.✓ Furthermore, the reduction in transport costs was through containerisation, more fuel efficient ships, or larger cargo vessels.✓ This lowered the transport costs will lower the price of traded goods and expand the set of goods worth trading internationally.✓ This will lead to higher volumes of trade and hence global supply chains will be more integrated, which fuels globalisation.✓
1Correctp.11
E3(a) Two factors
Trade liberalisation and ICT/transport correctly named.
technological advances and increasing liberalisation in trade, capital and labour markets
2Partialp.11
E3(a) ICT / transport
ICT and transport both appear. Strengthen transport: high transport costs once eroded gains from trade; after huge cost falls, mutually beneficial trade became viable again.
Developments in information and communications technology
What to do next: Spell out the "gains eroded → then restored" transport story, not only "costs fell so trade rose".
3CorrectDiagramp.11
E3(a) SG PPC/CPC
Specialisation/trade CPC outside PPC supports the liberalisation enabler.
Production Possibility Curve (PPC) and Consumption Possibility Curve (CPC) for Singapore
4CorrectDiagramp.11
E3(a) Partner PPC/CPC
Partner-country diagram completes the gains-from-trade picture.
Production Possibility Curve (PPC) and Consumption Possibility Curve (CPC) for China
Question 3(b) · [15]
Assess whether current global economic development will have a positive or negative effect on Singapore's future economic performance.
6/15
Pages 12–14
E3(b) R1: Positive impact on SG2/4
E3(b) R2: Negative impact on SG2/4
E3(b) Evaluation / weighing1/4
E3(b) Conclusion1/3
3(b)
Globalisation refers to the increasing interconnectedness, integration and interdependence of economies, societies, cultures and institutions worldwide.✓ It is driven by advances in technology, communication, transport and the liberalisation of trade and investment.✓ Globalisation manifests as greater flows of goods and services, and increased mobility of capital and labour across international borders.✓ Current global economic development includes the increase in globalisation and also the rising threat of uncertainty and instability in recent years.✓ This essay will assess whether the current global economic development will have a positive or negative effect on Singapore's future economic performance.✓
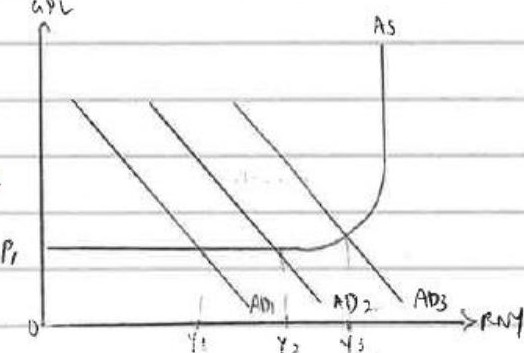
Current global economic development and an increasingly globalised world can have positive impacts on Singapore.✓ Globalisation leads to increased interconnectedness and flow of trade, which stimulates global economies, including Singapore by incentivising technological advancements and increasing capital and labour productivity when firms resort to offshoring and outsourcing to make production processes more efficient.✓ This decreases unit cost of production.✓ Furthermore, the increase in foreign direct investment will lead to an increase in investment expenditure(5) and an increase in export led development leads to an increase in (X-M). This leads to an increase in AD.✓ There will also be an increase in AS due to capital accumulation due to FDI, which leads to an increase in productive capacity, causing LRAS to shift rightwards from AS1 to AS2.✓ As AD increases from AD1 to AD2, firms face an unplanned fall in inventories, and increase production, hence hiring more factors of production, including labour.✓ Household income increases which leads to an increase in induced consumption and hence another round of increase in AD.✓
Thus the multiplier process occurs and AD increases until level of injections is equal to level of withdrawals at AD1 (W=J).✓ The increase in productive capacity which shifts LRAS outwards, and and This stimulates actual and potential economic growth, which hence leads to a sustained economic growth.✓ Demand-deficient unemployment also decreases due to the increase in derived demand for labour.✓ Thus current global economic development such as the rise of globalisation has led to positive impacts in the form of economic growth and decrease in unemployment.✓
To evaluate the extent of benefits of current global economic developments on the Singapore economy, the state and nature of the economy.✓ Singapore is a small and open economy with a relatively small multiplier due to high marginal propensity to save, import and tax.✓ Hence the increase in AD will be limited and AD will face an overall increase from AD1 to AD2 instead of AD3.✓ Hence real national income will not increase to as large of an extent as intended, which leads to the still persisting problem of demand-deficient unemployment and increase in economic growth will be hindered.✓
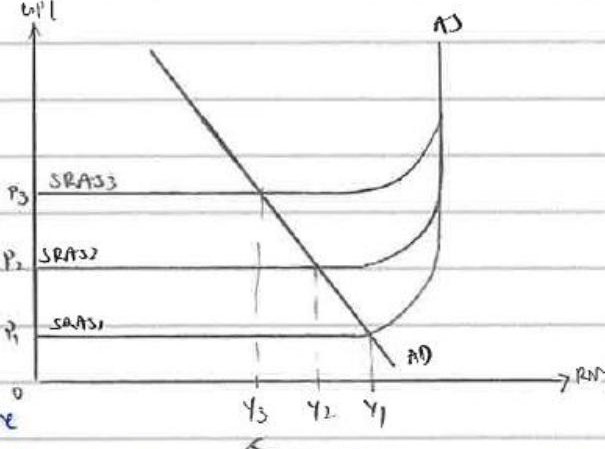
Current global economic developments can also have a negative effect on Singapore's future economic performance, due to the uncertainty and instability of the global economies, which threatens the benefits of globalisation.✓ The uncertainty and instability of the global economies may lead to supply chain disruptions.✓ This will lead to an increase in competition between countries for limited supply of goods(7) - they will bid up higher prices for these factors of production which increases the unit cost of production of goods. This is shown by an decrease in SRAS as seen by an upward shift of SRAS from SRAS1 to SRAS3.✓ Firms pass on the higher cost to consumers in the form of higher prices, which is shown by an increase in general price level from P1 to P3.✓ This increased in general price level will lead to cost push inflation.✓ The economy will also experience negative actual economic growth, causing real national income to decrease via the real wealth effect, international substitution effect, and interest rate effect, from Y1 to Y3.✓ Thus global economic developments can also have a negative effect on the Singapore's economy as it may lead to cost push inflation, and negative actual economic growth, and cause decrease in material standard of living.✓
and consumers purchasing power decreases.✓
To evaluate the extent of the current global economic developments and negative effects on Singapore's economy, we should consider the nature of Singapore's economy.✓ As Singapore is very trade reliant and lacks its own domestic factors of production, supply chain disruptions due to growing uncertainty and instability will lead to a huge loss [crossed out] increase in competition for resources, which fuels the increase in general price level more than proportionately, hence cost push inflation will be more severe.✓
In conclusion, current global economic developments will have both positive and negative effects.✓ However there will be a net positive effect on Singapore's economic performance in the long run(10). Global uncertainties and instability such as supply chain disruptions and geopolitical tensions can be resolved with corrective policies such as supply side policies, hence they will not be such a big concern in the long term.✓ In the future, globalisation [crossed out] takes precedence as the stimulation of Singapore's economy by attracting FDI and trade will lead to long-term sustained growth and help expand S'pore to become a more globalised economy in the future.✓ Thus, current global economic development will have a net positive effect on Singapore's future economic performance.✓
5Partialp.12
E3(b) Positive channel
Positive AD/AS growth from globalisation is generic. For "current" developments, use recent events (US-China tensions, instability, wars) and then the SG channel (e.g. safe-haven FDI).
the increase in foreign direct investment will lead to an increase in investment expenditure
What to do next: Name concrete recent events in the intro/topic sentences before the AD/AS mechanism.
6CorrectDiagramp.12
E3(b) AD-AS growth
AD and AS/LRAS shifts match the sustained-growth prose.
Macroeconomic AD-AS model graph showing shifts in aggregate demand and aggregate supply curves.
7Partialp.13
E3(b) Cost-push risk
Cost-push from supply-chain disruption needs named recent sources of uncertainty (trade tensions / wars / political instability).
This will lead to an increase in competition between countries for limited supply of goods
What to do next: Replace vague "uncertainty" with 1–2 concrete recent events, then run the SRAS mechanism.
8CorrectDiagramp.13
E3(b) Small-k diagram
AD1 vs AD2 vs AD3 illustration of limited multiplier for Singapore is useful.
Aggregate Demand and Supply (AD-AS) model graph showing shifts in AD curves (AD1, AD2, AD3) against an AS curve, with axes for General Price Level (GPL) and Real National Income (R
9CorrectDiagramp.13
E3(b) SRAS cost-push
SRAS1→SRAS3 with GPL↑ / Y↓ matches the negative story.
Aggregate Demand and Supply (AD-AS) model graph showing upward shifts in Short-Run Aggregate Supply (SRAS1, SRAS2, SRAS3) against an AD curve, illustrating cost-push inflation.
10Partialp.14
E3(b) Conclusion
Verdict is present, but without recent-event context the (b) argument stays too vague against the updated standard.
there will be a net positive effect on Singapore's economic performance in the long run
What to do next: Rebuild (b) around recent events on both the downside and any upside (safe haven), then give a net long-run judgement.



(a)(i) Wording issue
For this 2m item: 1m for identifying the deficit, 1m for saying it worsened. You have the deficit (M>X), but "trade balance increased" muddies the trend mark.
the magnitude of X-M faced an overall increase, which indicates that the trade balance increased
What to do next: State clearly: the US was in a trade deficit, and the deficit worsened from 2014 to 2018 (with optional anomaly).