
H2 Mathematics
H2 Math — 2025 Prelim Paper 2 (demo)
Feedback pinned onto the pages the student wrote. Scan the QR (or open the link) for a sample Cherlock clarification chat.
Question paper: 2025 H2 Math Prelim Paper 2 · opens in a new tab

Source question paper
2025 H2 Math Prelim Paper 2 — compare the marked script below with the original questions.
 Studyszn QuickMark
Demo Student feedback
Score: 65 / 100
General feedback
Overall you scored 65/100 on this 2025 H2 Math Prelim Paper 2.
Strengths
- Q2 functions was excellent (10/10): existence, rule, domain, range and inverse were all clear.
- Q4 complex numbers was strong (10/12): roots and Argand diagram were good.
- Q8 binomial modelling was full marks (9/9).
- Q10 normal distribution was almost full marks (9/10).
Next steps
- Finish incomplete questions: Q3(c), Q6(b), Q7(d) and Q11(d) lost many marks because work was missing.
- In Q3(b), check factorisation carefully: from you should get , then max .
- In Q11(b), remember unbiased variance is times the sample variance, so . That also fixes your hypothesis test conclusion.
- Q5(a): all 20 club members are a population, not a sample. Q5(d) total should be 1925.
- Q9(e): correlation is not causation. Q4(d): the shape is a trapezium with area 3.75.
Mark summary
65 / 100
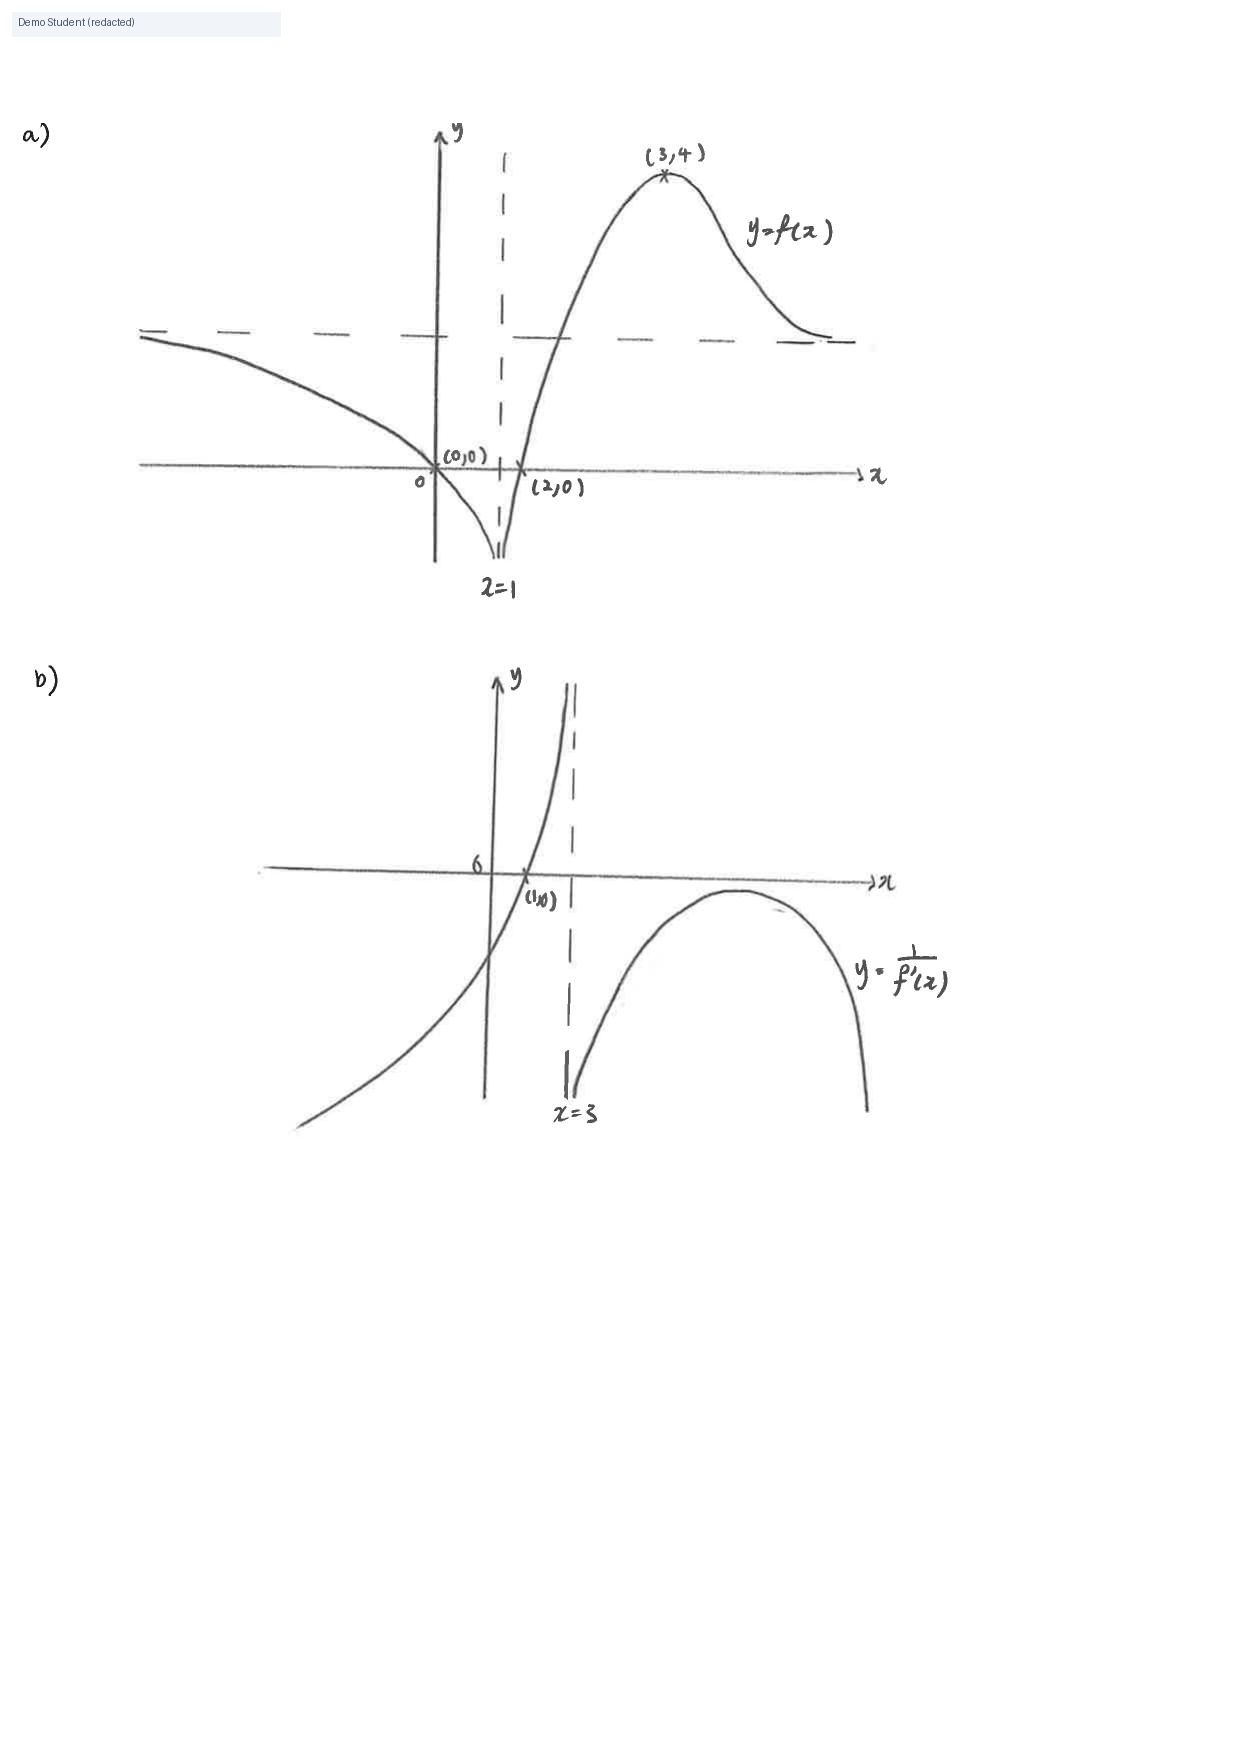
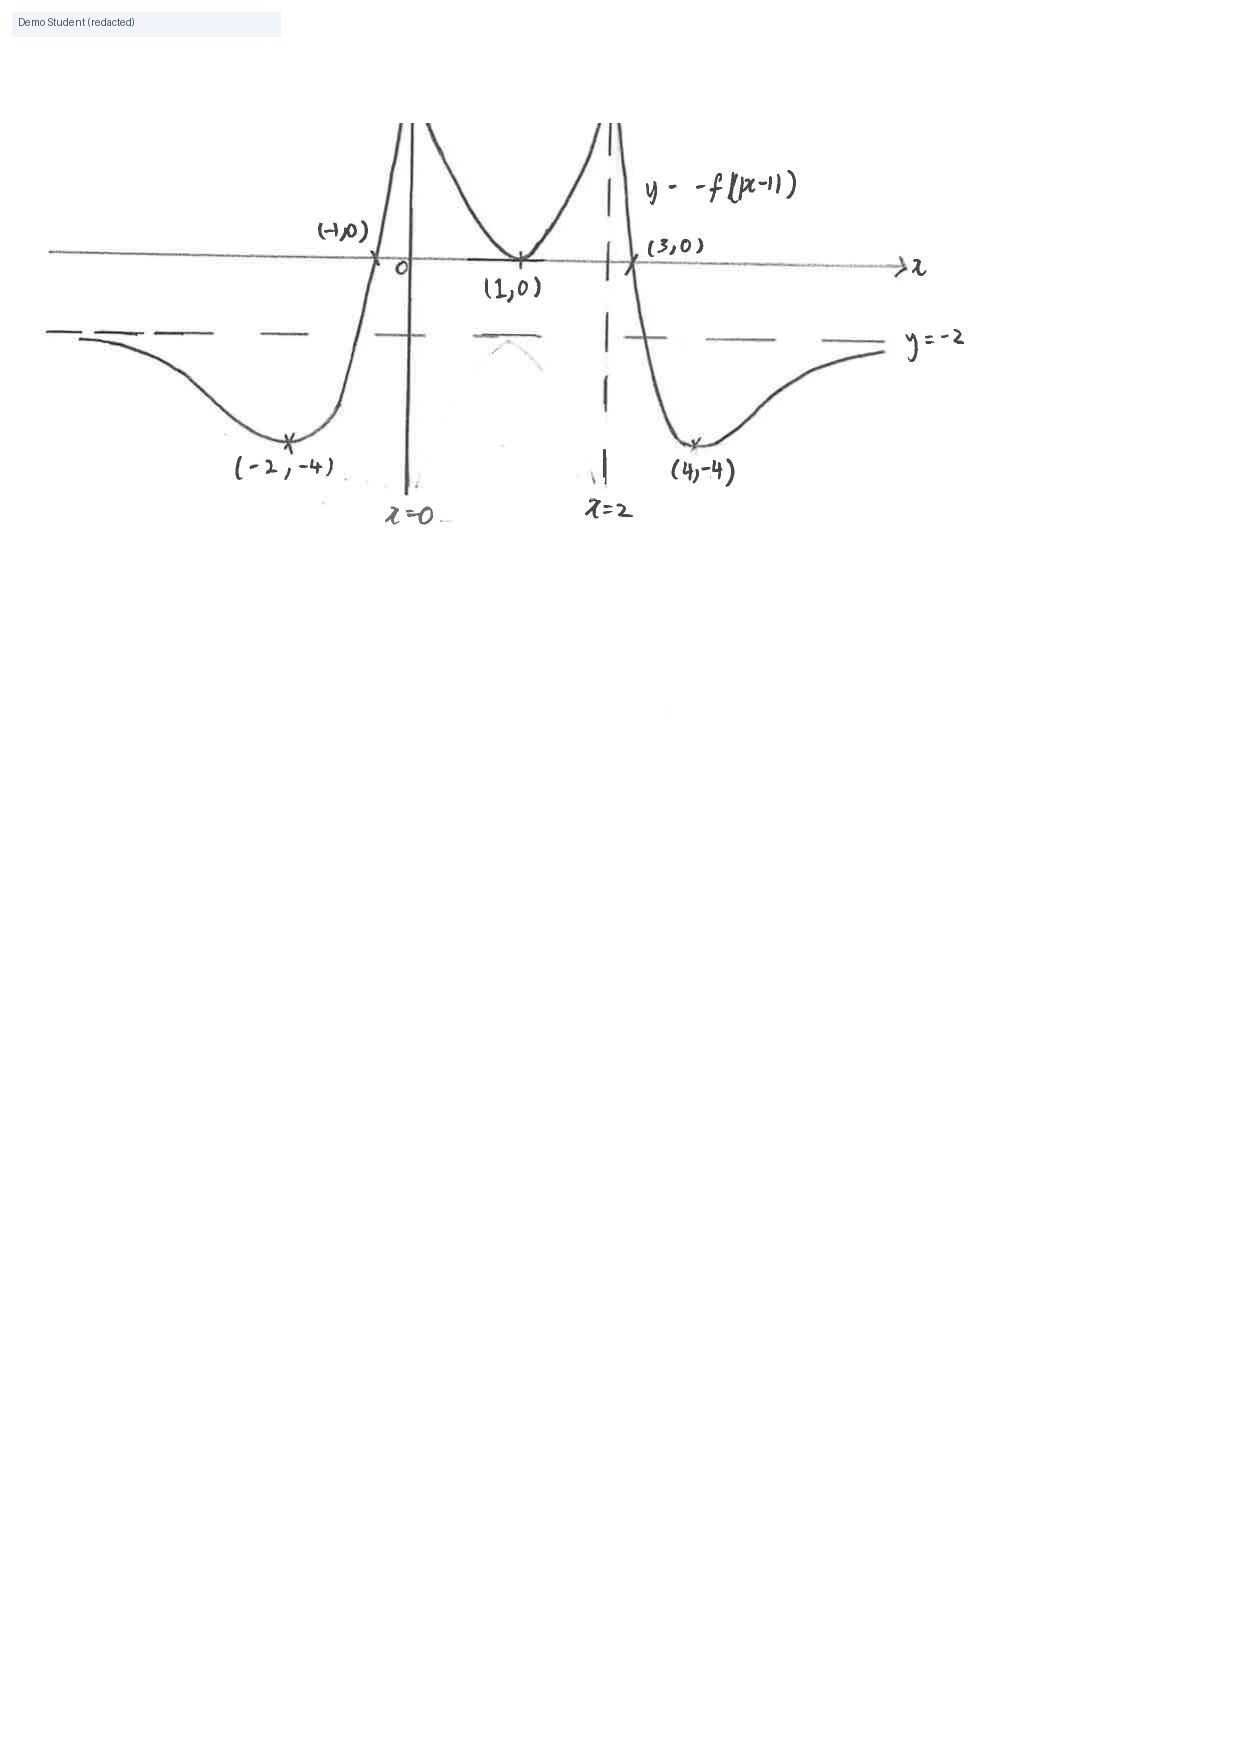
Q1(a) incomplete sketch
This sketch is incomplete for . You need the reflection in the -axis, including , and .
only right half
What to do next: Reflect the part of in the -axis, and include both vertical asymptotes.
Q1(b) asymptote x=3
Correct. The zero of at becomes a vertical asymptote of .
Q1(b) branches through (1,0)
Correct. You have the intercept and the right branch shapes for .
rising left branch
Q1(b) max in 4th quadrant
Correct. For the stationary point of is below the -axis.
4th quadrant max
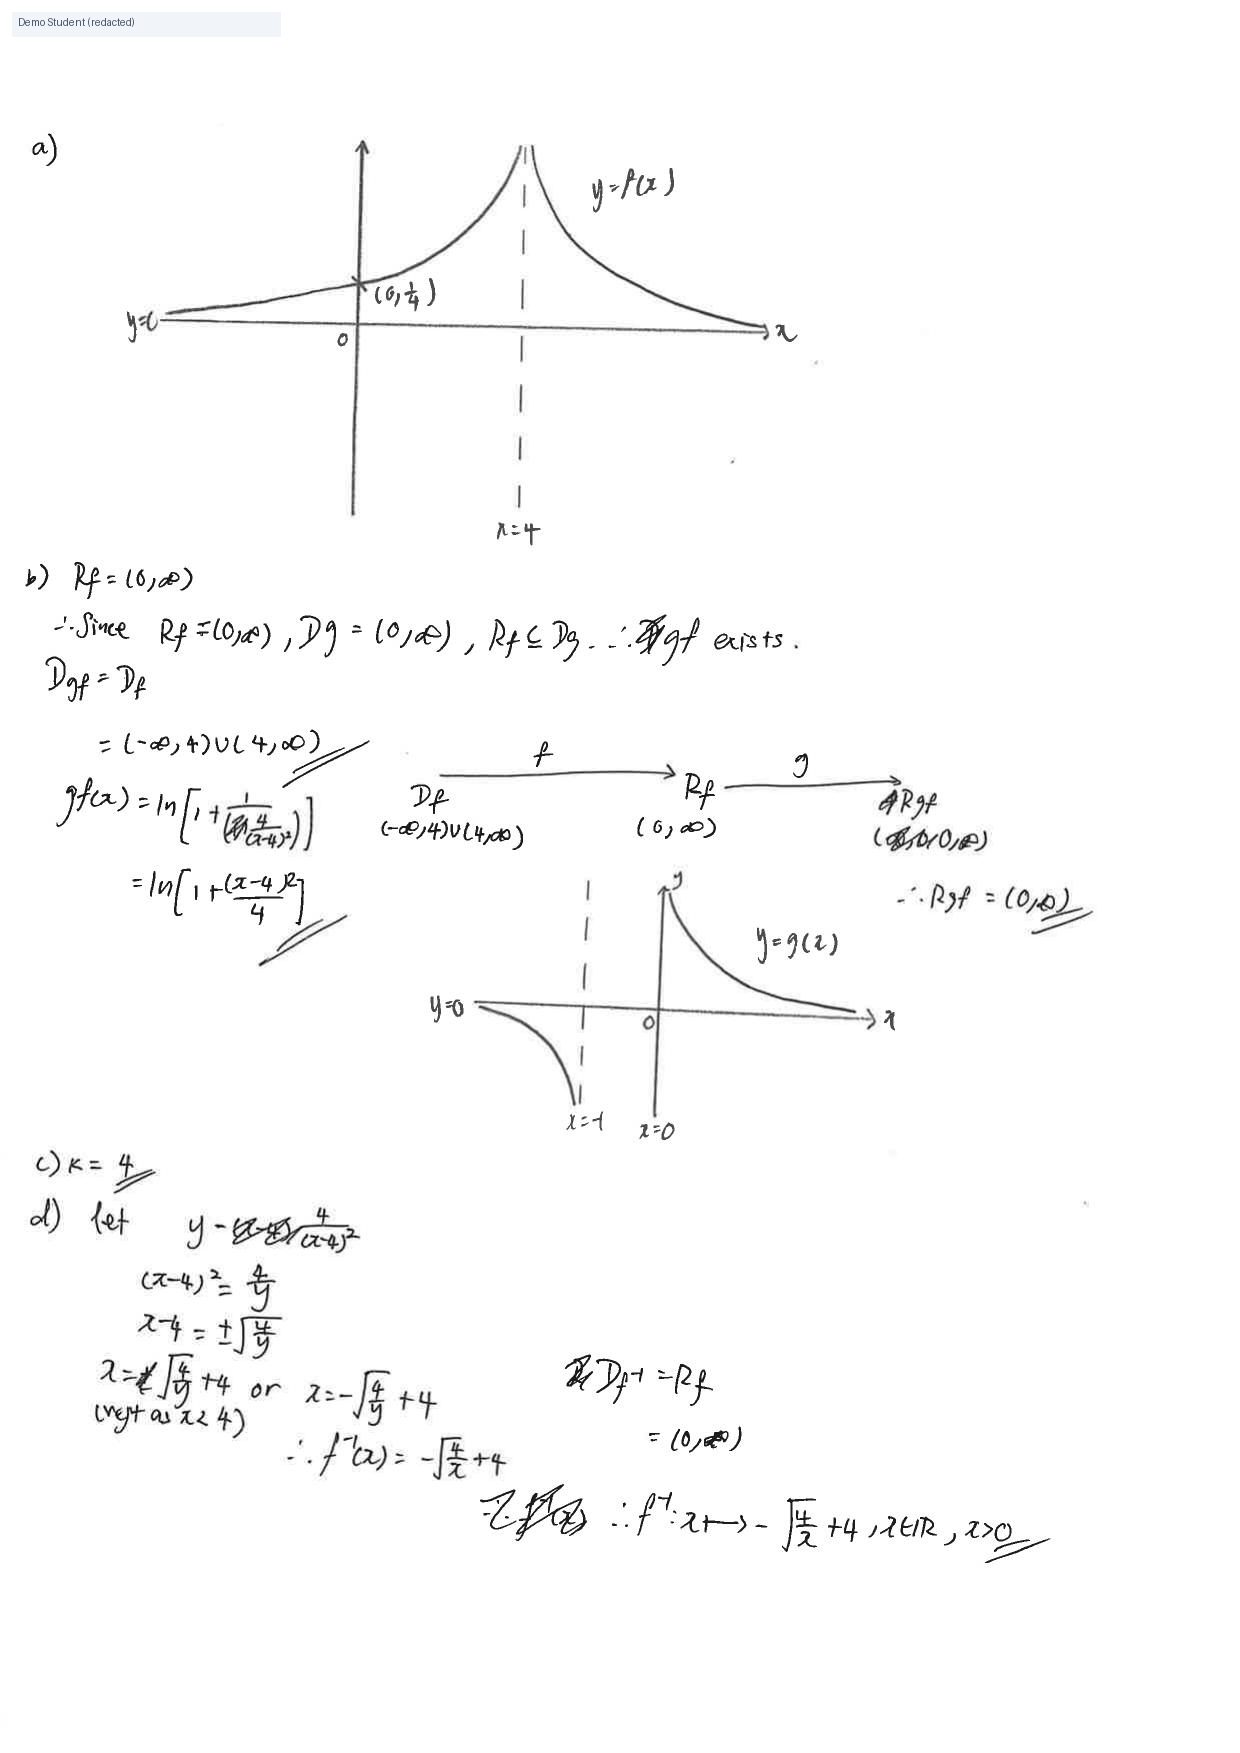
Q2(a) intercept
Correct y-intercept (0, 1/4) and curve shape.
Q2(a) asymptotes
Correct. Vertical asymptote x = 4 and horizontal asymptote y = 0.
,
Q2(b) existence
Correct. Since , exists.
Rf subset Dg
Q2(b) domain
Correct domain of gf.
R\{4}
Q2(b) range
Correct range (0, infinity), justified via the mapping.
Q2(b) rule
Correct rule for gf(x).
Q2(c) largest k
Correct. Largest k is 4.
Q2(d) plus-minus
Correct. You included both square-root branches.
±
Q2(d) reject branch
Correct rejection using the restricted domain .
rejt as x<4
Q2(d) inverse form
Correct inverse in similar form, with domain x > 0.

No comments on this page.
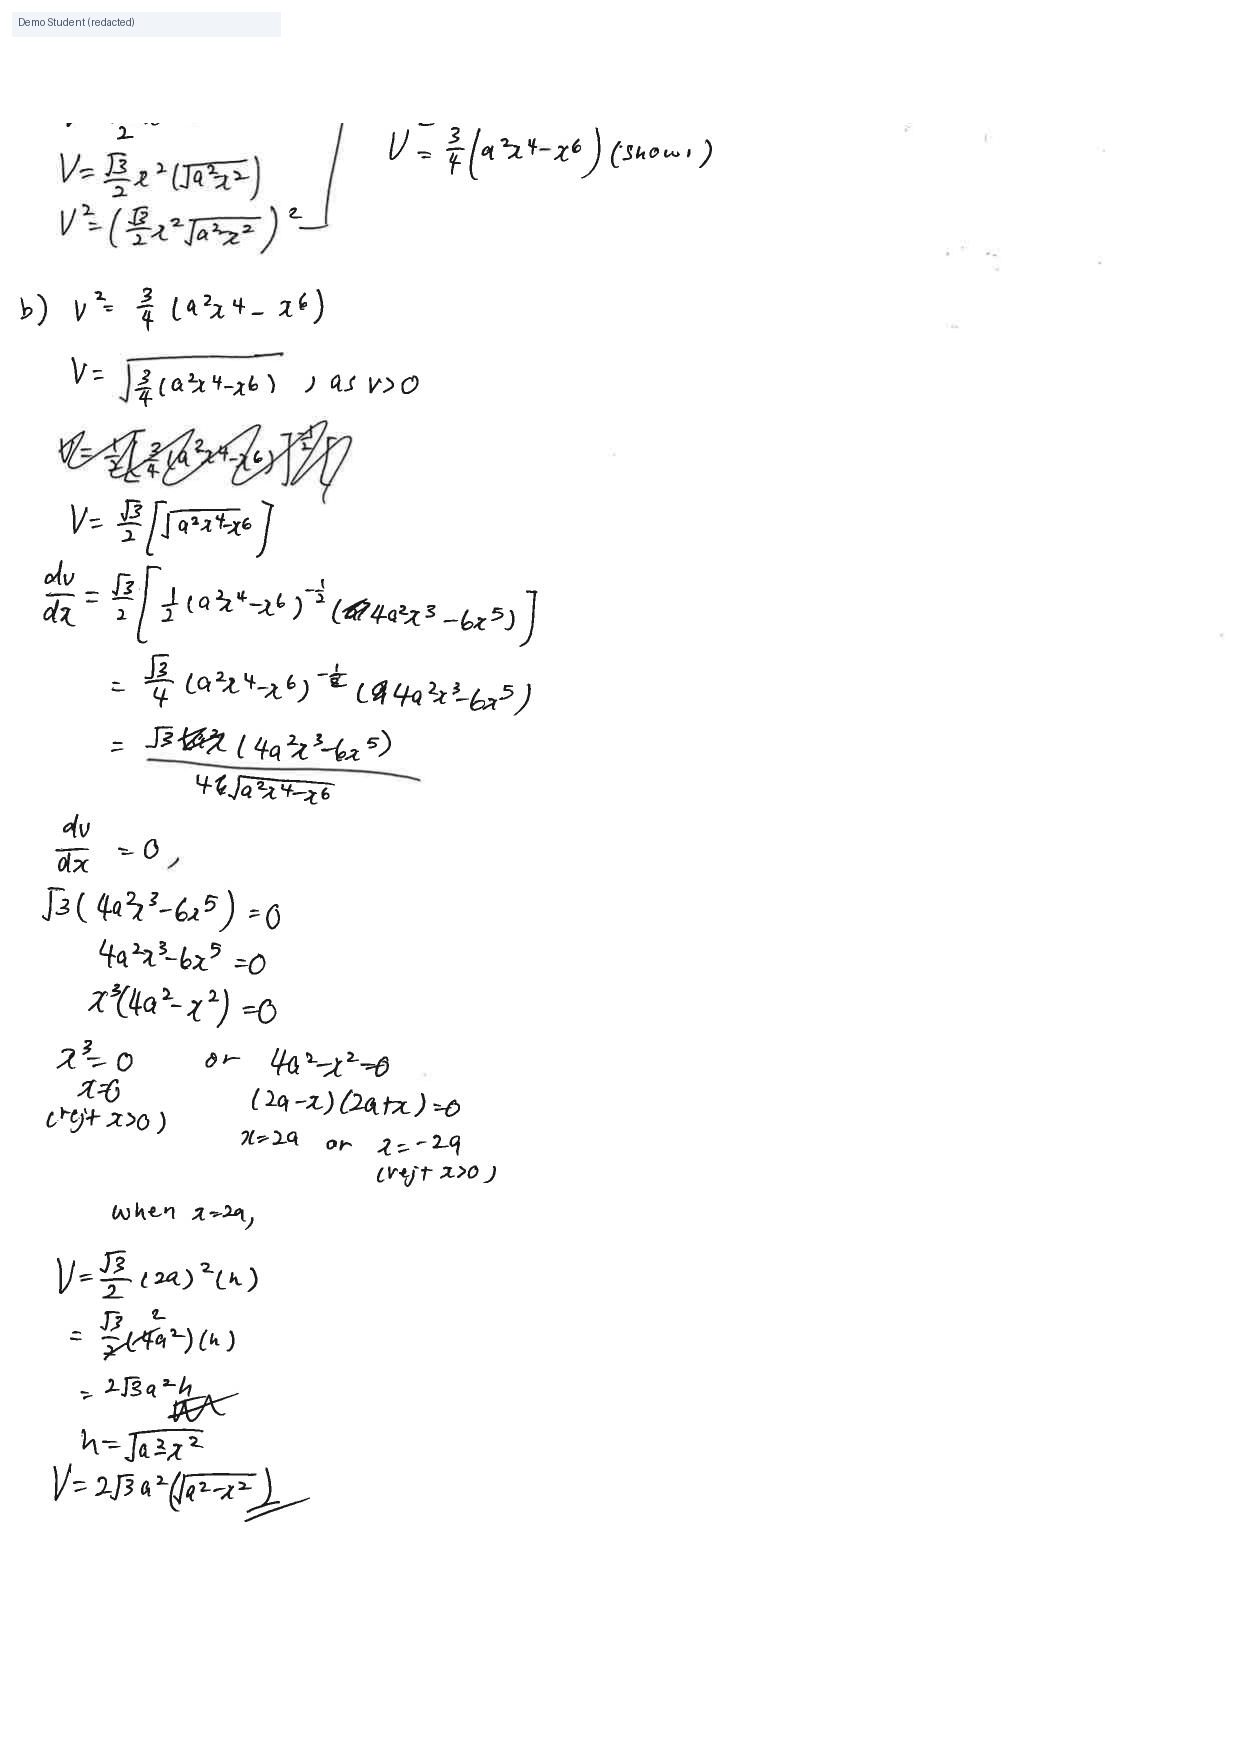
Q3(a) height
Correct. You expressed using Pythagoras.
Q3(a) shown result
Correct derivation of the given expression.
shown
Q3(b) differentiate
Good. You differentiated and set .
Q3(b) algebra error
When factorising , the factor should be , so , not .
What to do next: Factor out carefully: .
Q3(b) max volume
The maximum volume must be in terms of only. With the correct , max .
left in terms of x,h
What to do next: Substitute into and simplify fully.
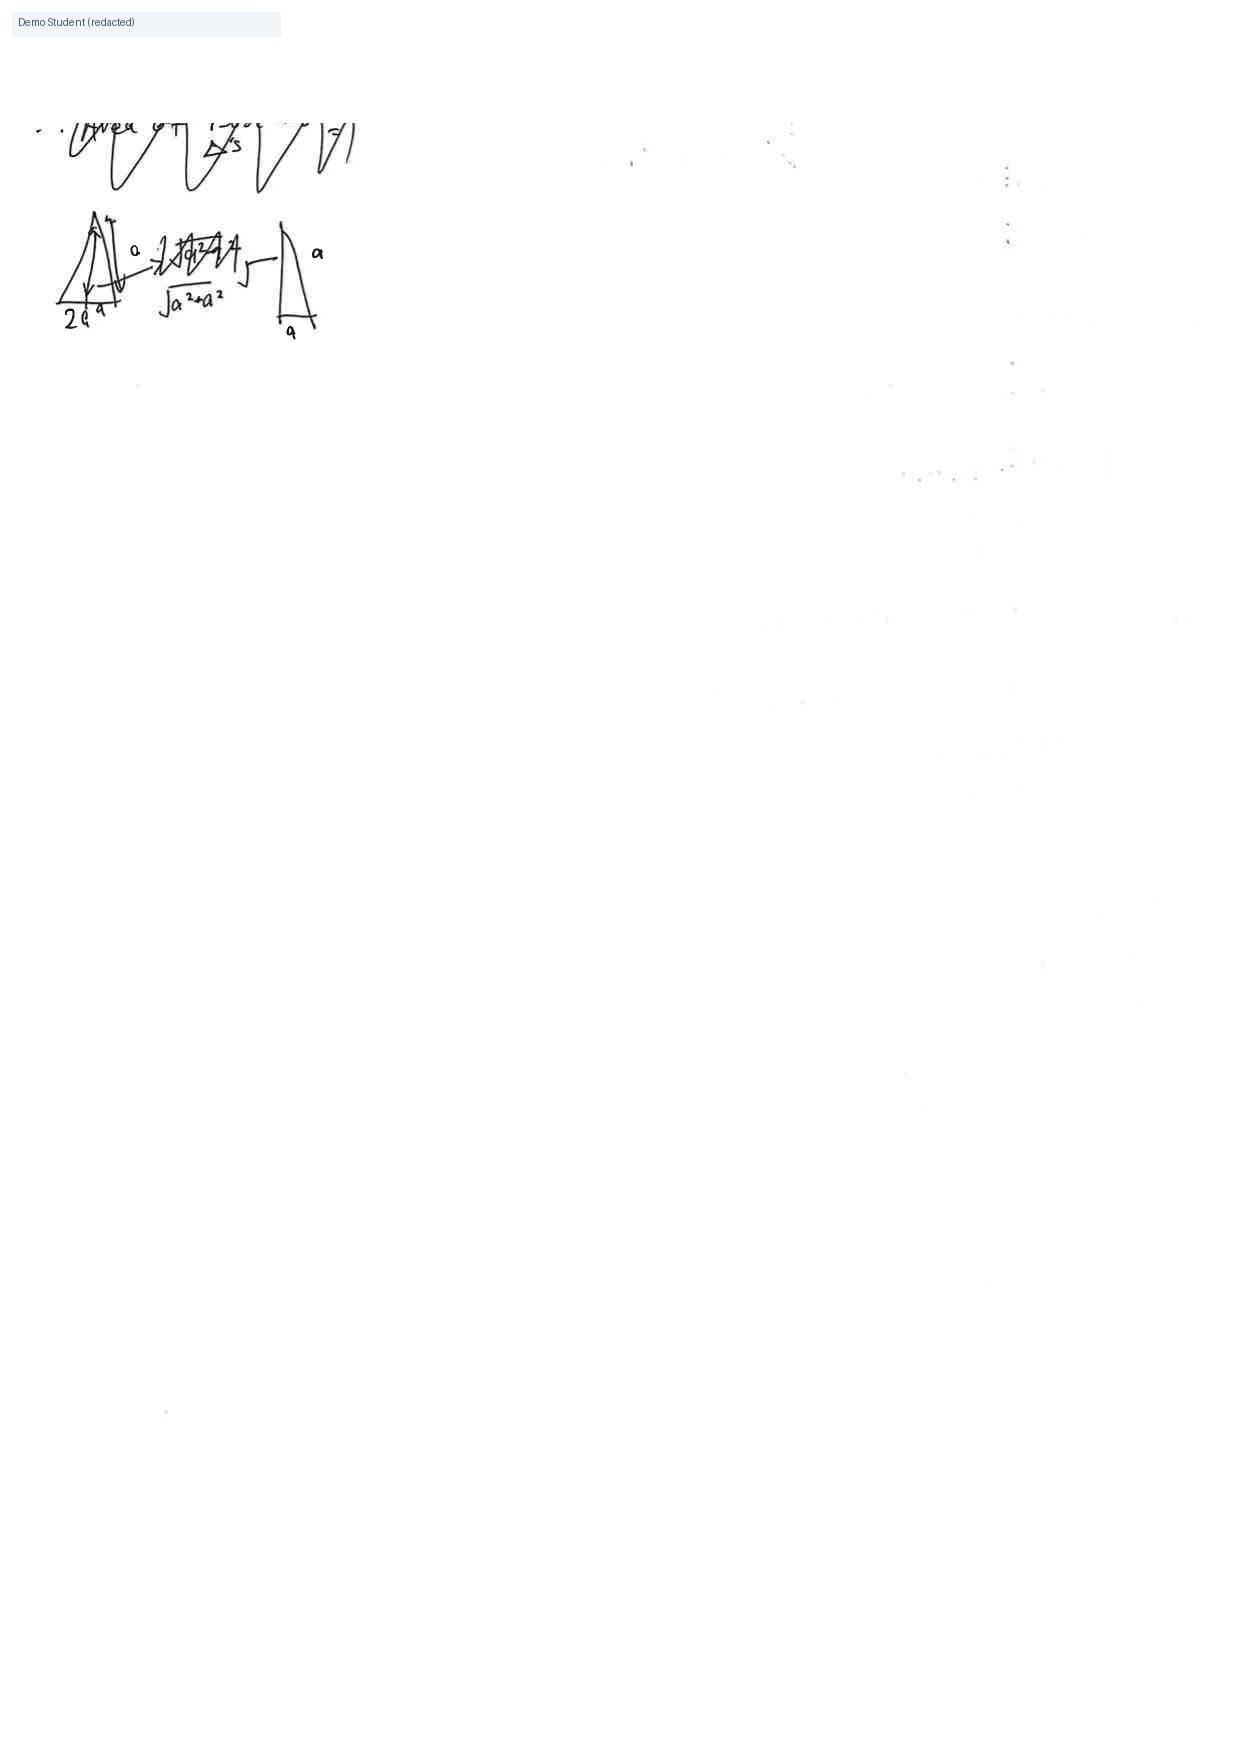
Q3(c) incomplete
Q3(c) is incomplete. You need the total surface area at the maximum volume: (exact form from the scheme).
only
What to do next: Find the lateral triangle area and hexagon area using the correct x, then add them.
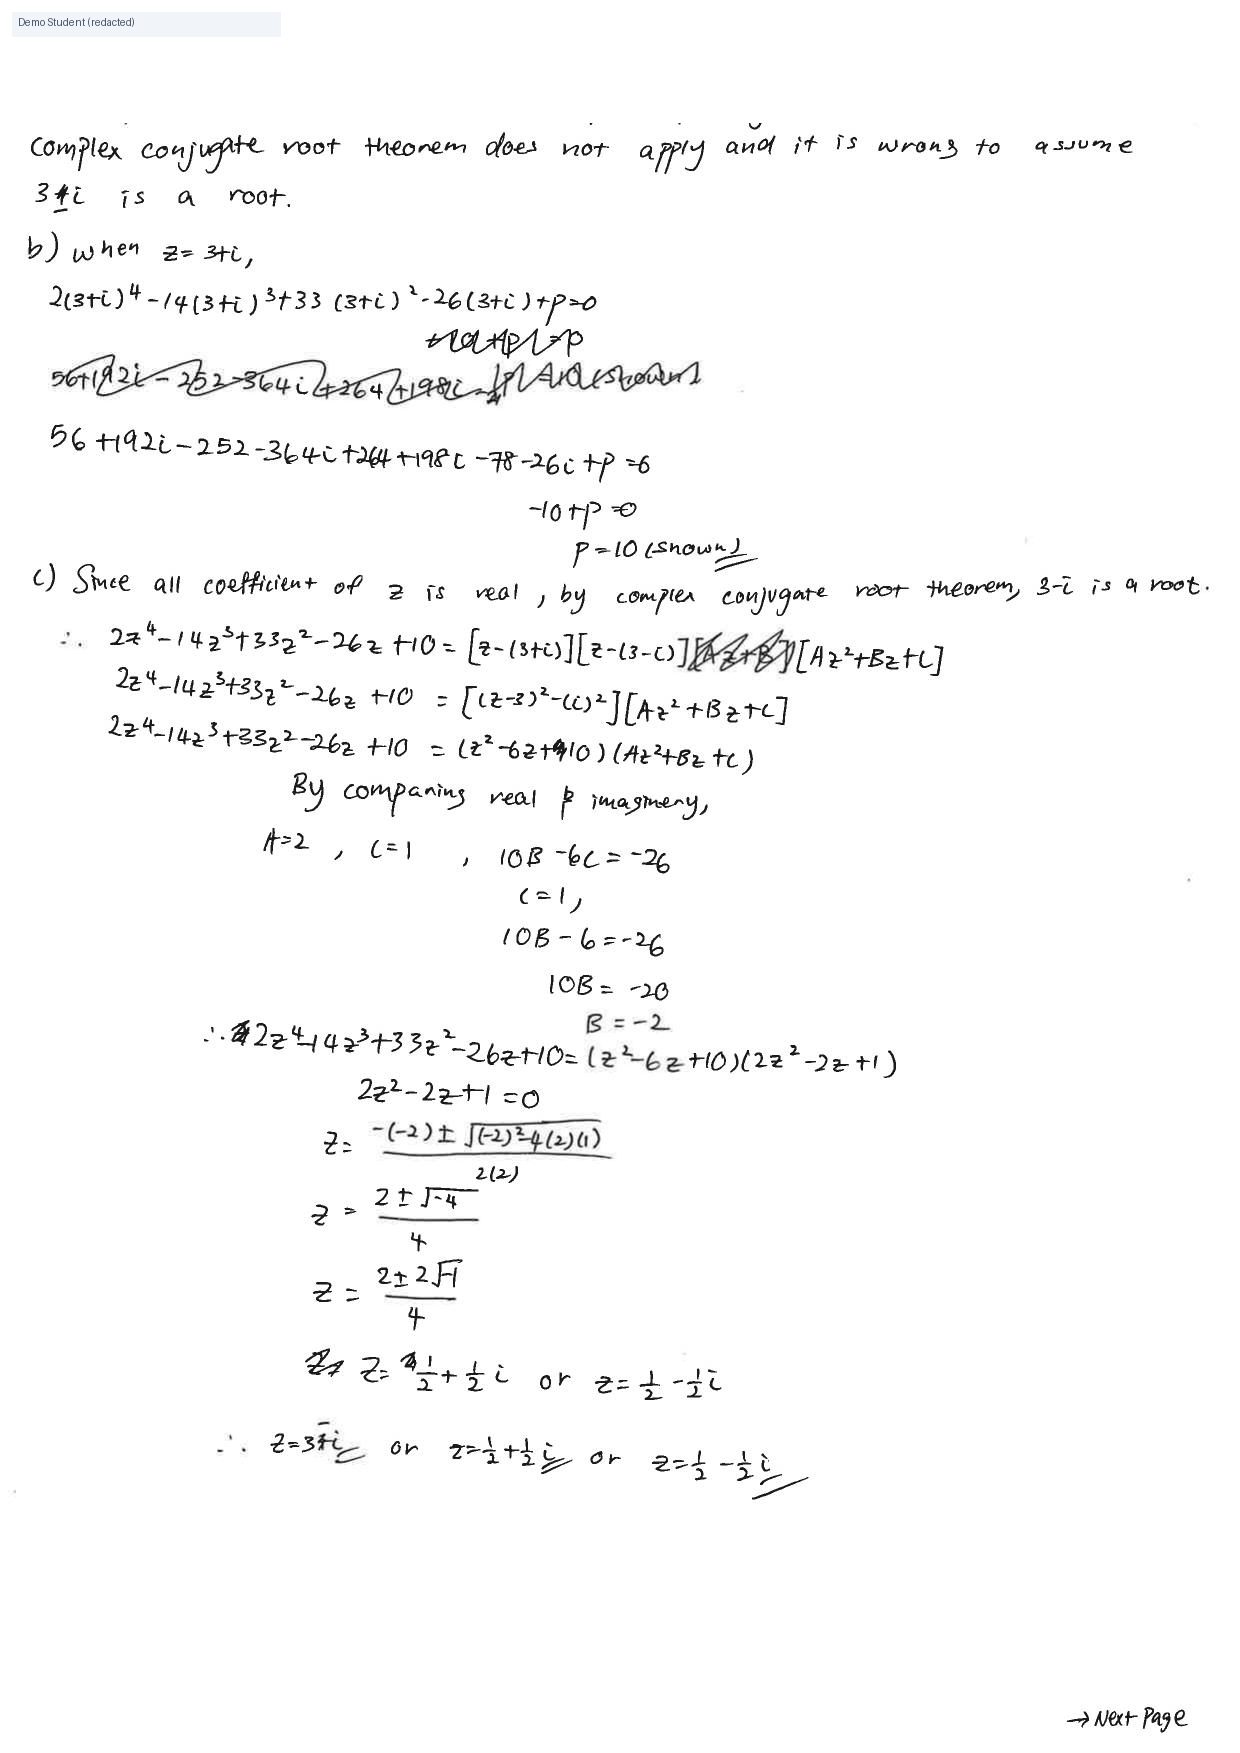
Q4(a) reason
Correct. Without knowing p is real, the conjugate root theorem need not apply.
p may not be real
Q4(b) p=10
Correct substitution and result p = 10.
Q4(c) conjugate root
Correct use of the conjugate root theorem with real coefficients.
3-i root
Q4(c) quadratic factors
Correct quadratic factors.
Q4(c) all roots
Correct. All four roots found.
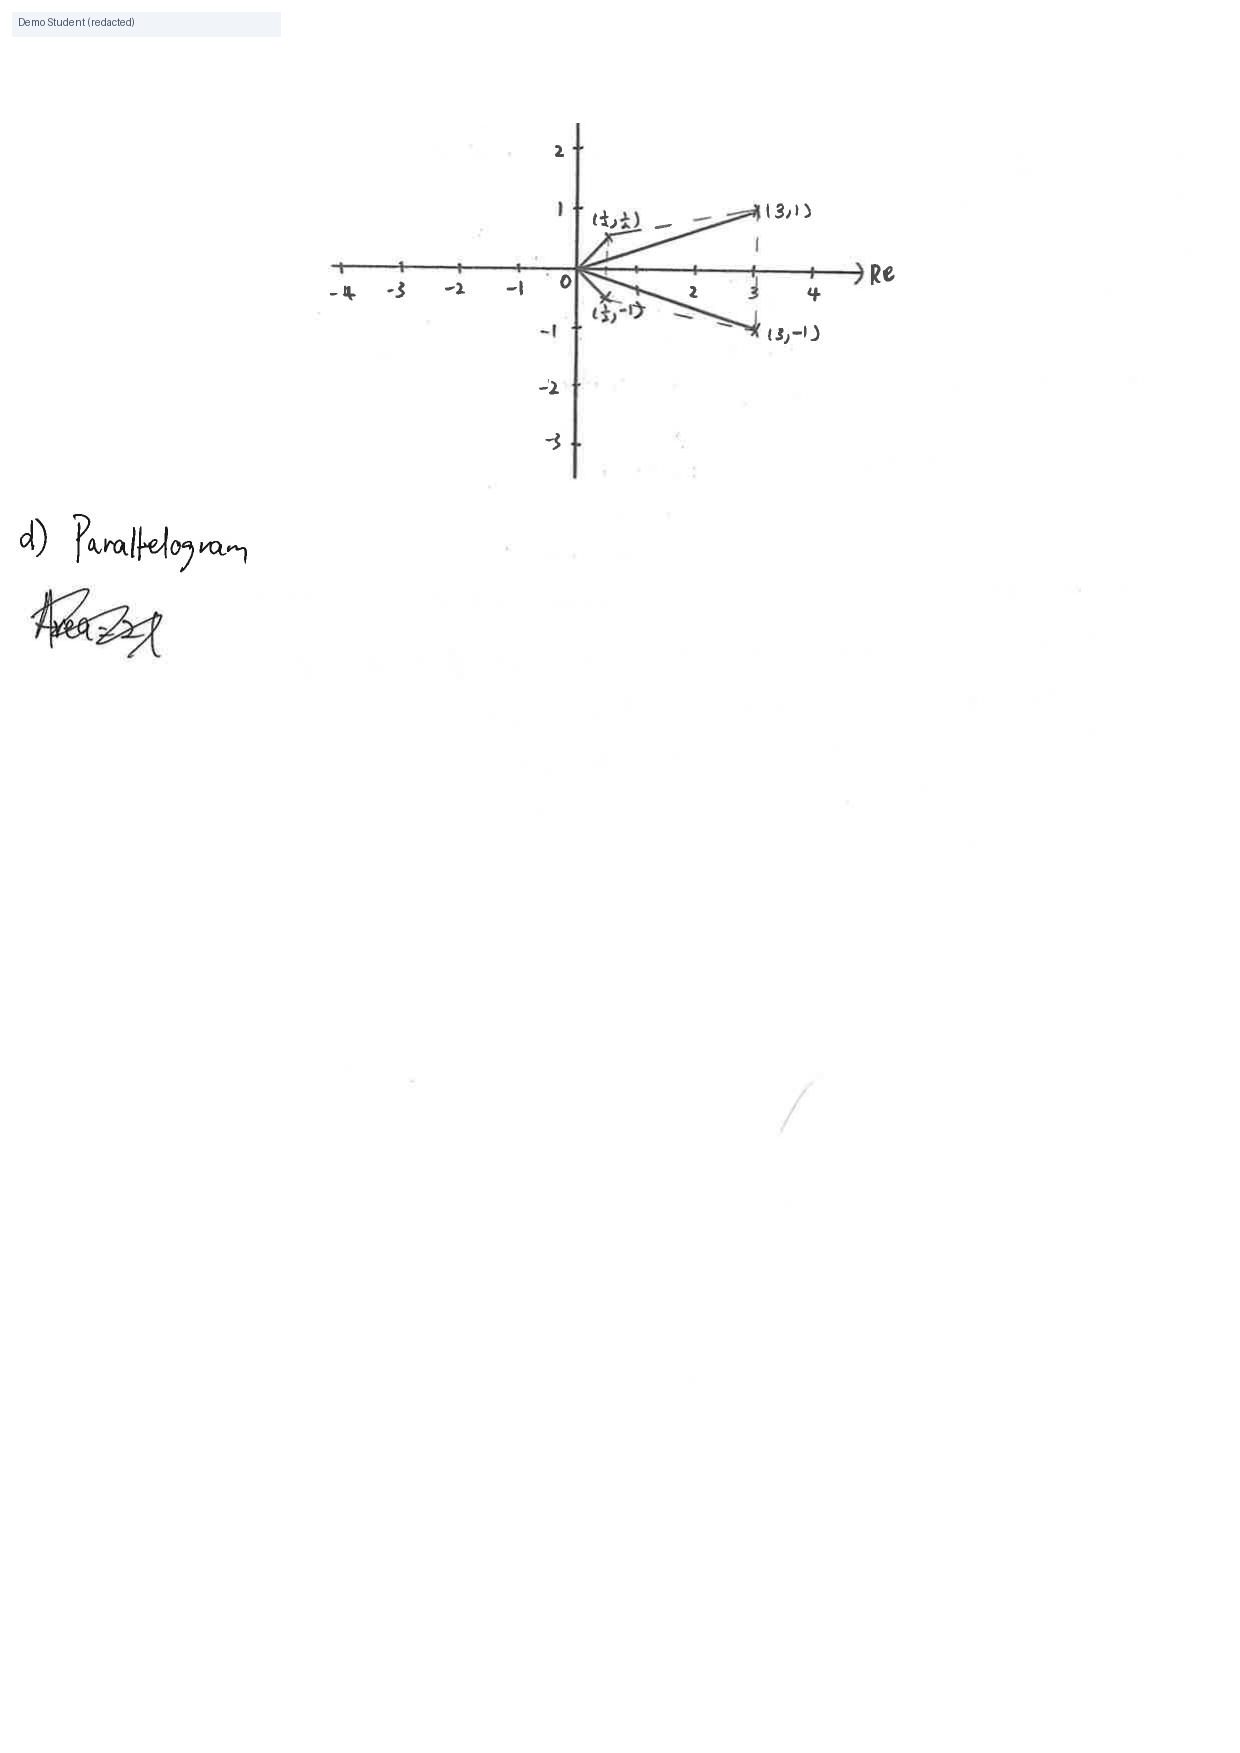
Q4(c) labelled axes
Good. Axes are labelled Re and Im.
Q4(c) plot 1/2±i/2
Correct plotting of 1/2 ± i/2.
Q4(c) plot 3±i
Correct plotting of 3 ± i.
Q4(d) wrong shape
The quadrilateral is a trapezium (two vertical parallel sides), not a parallelogram.
Parallelogram
What to do next: Name it as a trapezium (or trapezoid).
Q4(d) missing area
No clear area. Area (or ).
area scribbled
What to do next: Use (sum of parallel sides) × height / 2.
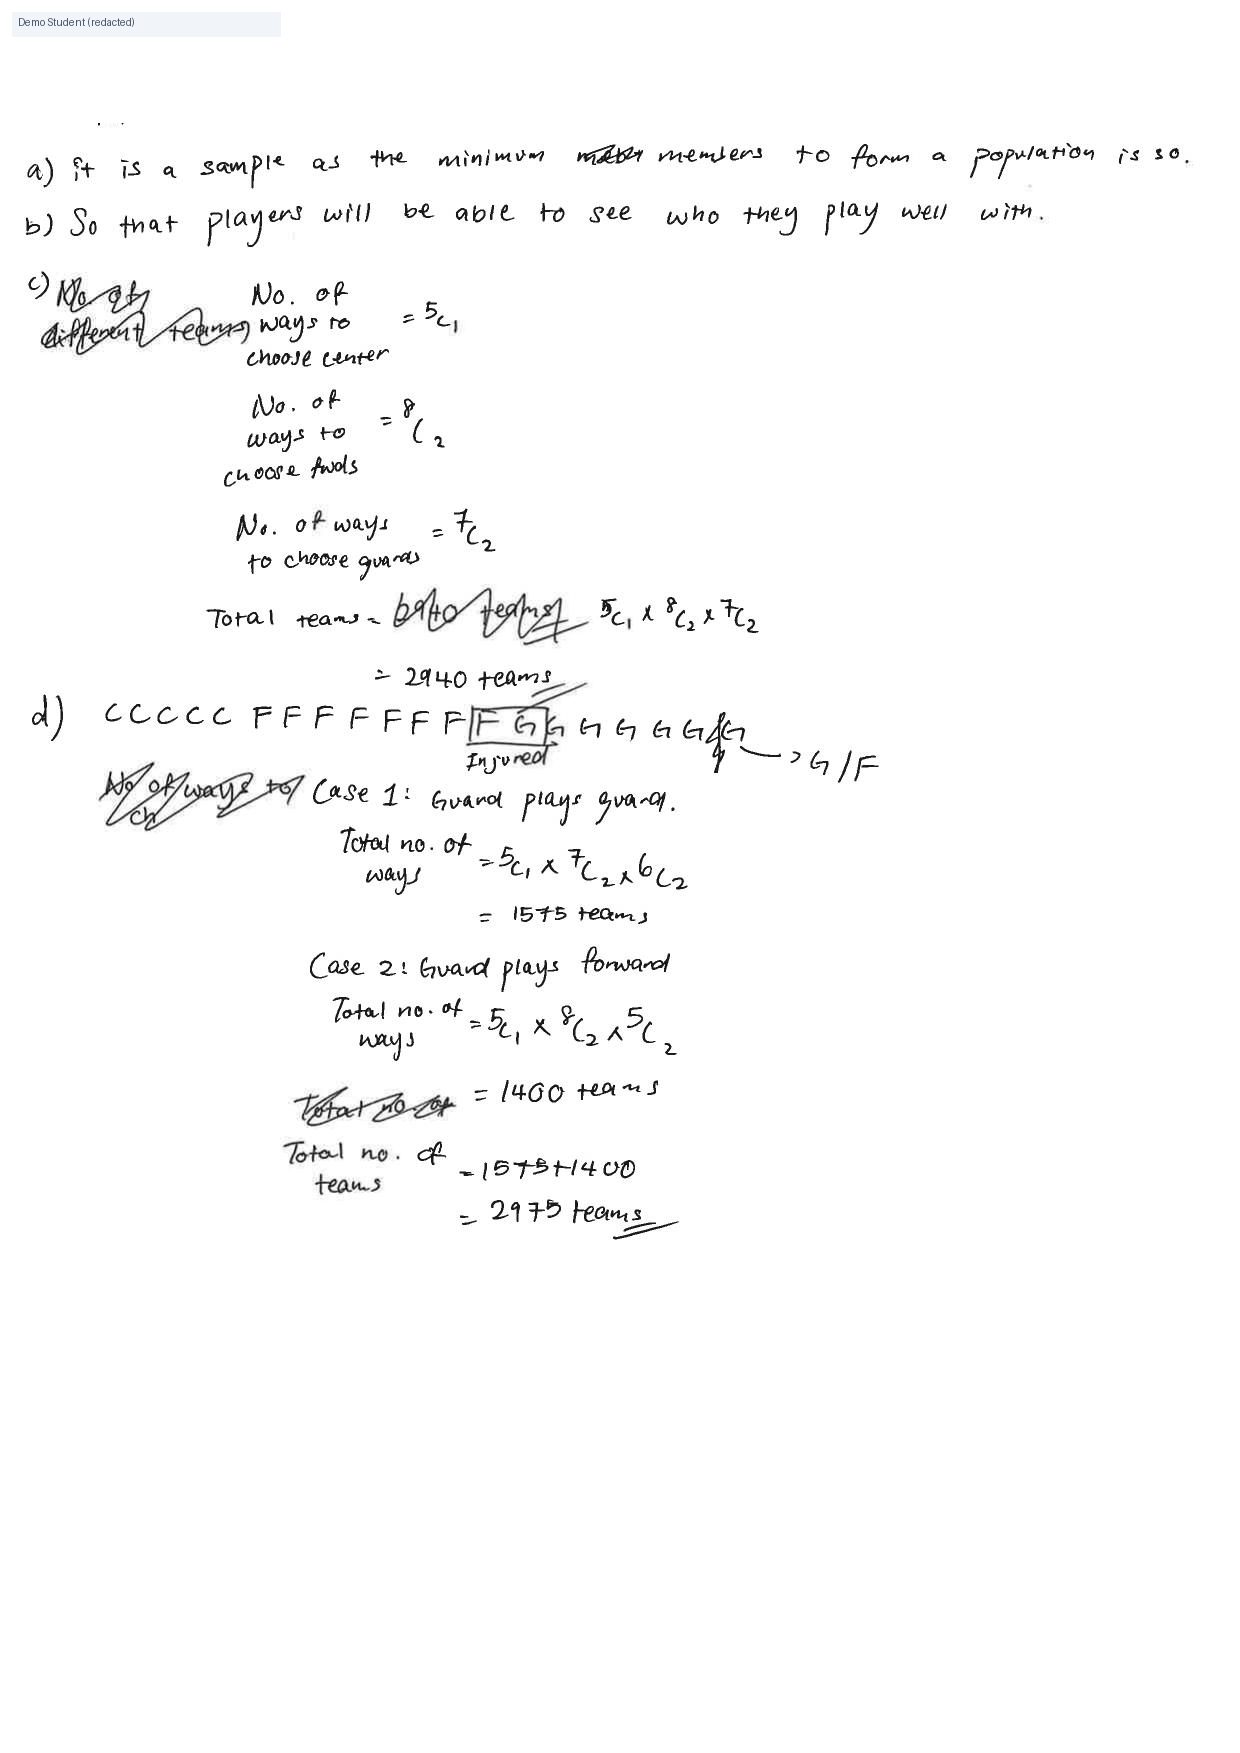
Q5(a) population not sample
These 20 members are a population: the coach surveyed every member of the club.
called sample
What to do next: Say population, because the questionnaire went to all club members.
Q5(b) advantage
The advantage should be about reducing bias / fairness / representativeness of a random sample in each category.
play well with
What to do next: Mention less bias, or a fairer / more representative selection.
Q5(c) number of teams
Correct. .
2940
Q5(d) case idea
Good idea to split into cases for the flexible guard.
Case 1/2
Q5(d) wrong total
The correct total is 1925. Your Case 2 overcounts (use the remaining 7 forwards and 5 guards carefully, and avoid double-counting when the flexible guard is not selected).
2975
What to do next: Follow Method 2: 1575 + 350 = 1925, with no overlap.

No comments on this page.
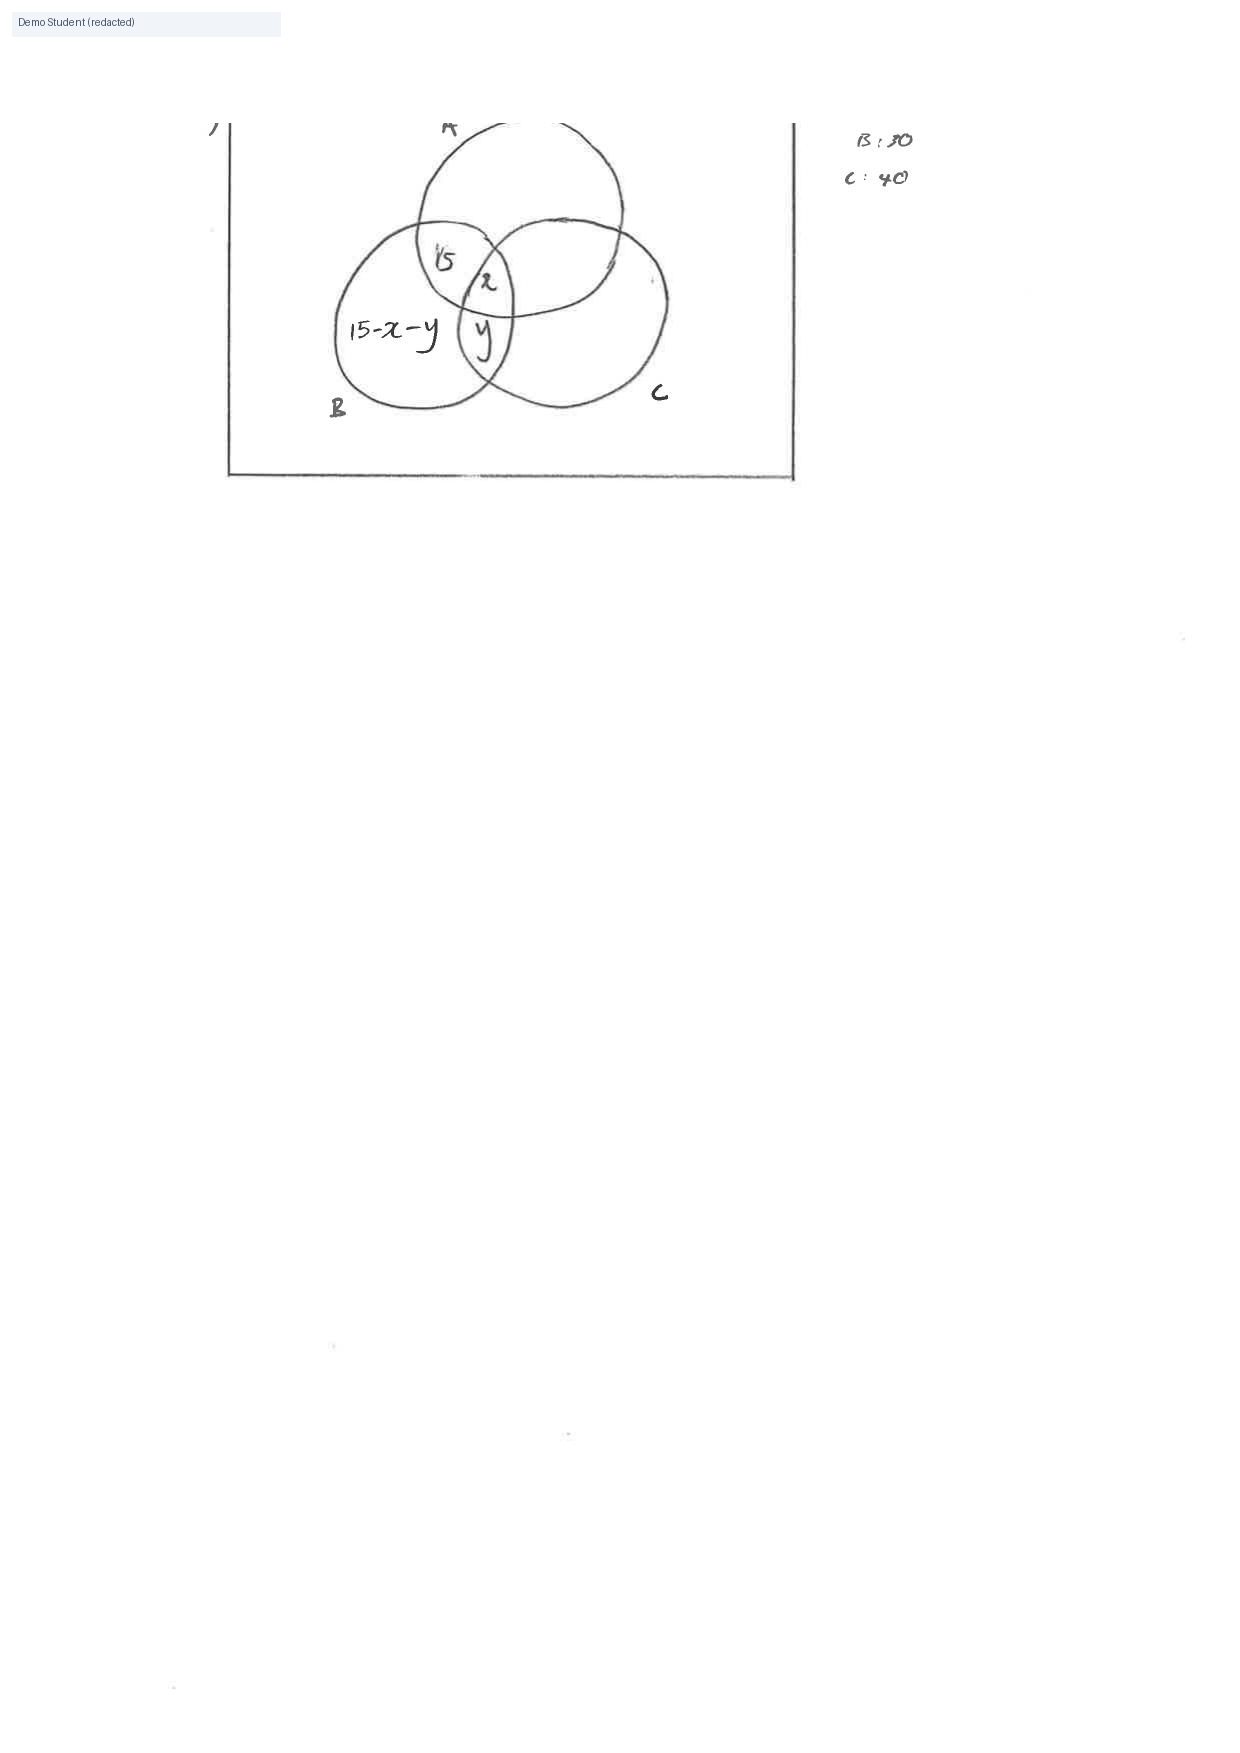
Q6(a) incomplete Venn
Many regions are blank. Use independence of A and C to get n(A∩C)=10, then fill every region (and outside).
sparse Venn
What to do next: Compute P(A∩C)=P(A)P(C)=0.1 so n(A∩C)=10, then complete all 8 regions.
Q6(a) x and y placed
Good. You placed x in A∩B∩C and y in B∩C only.
x,y
Q6(b) missing
Q6(b) is missing. From independence of B and C, , with greatest and least .
blank
What to do next: Use n(B∩C)=12, then constraints x≥0, y≥0, 10-x≥0.

No comments on this page.
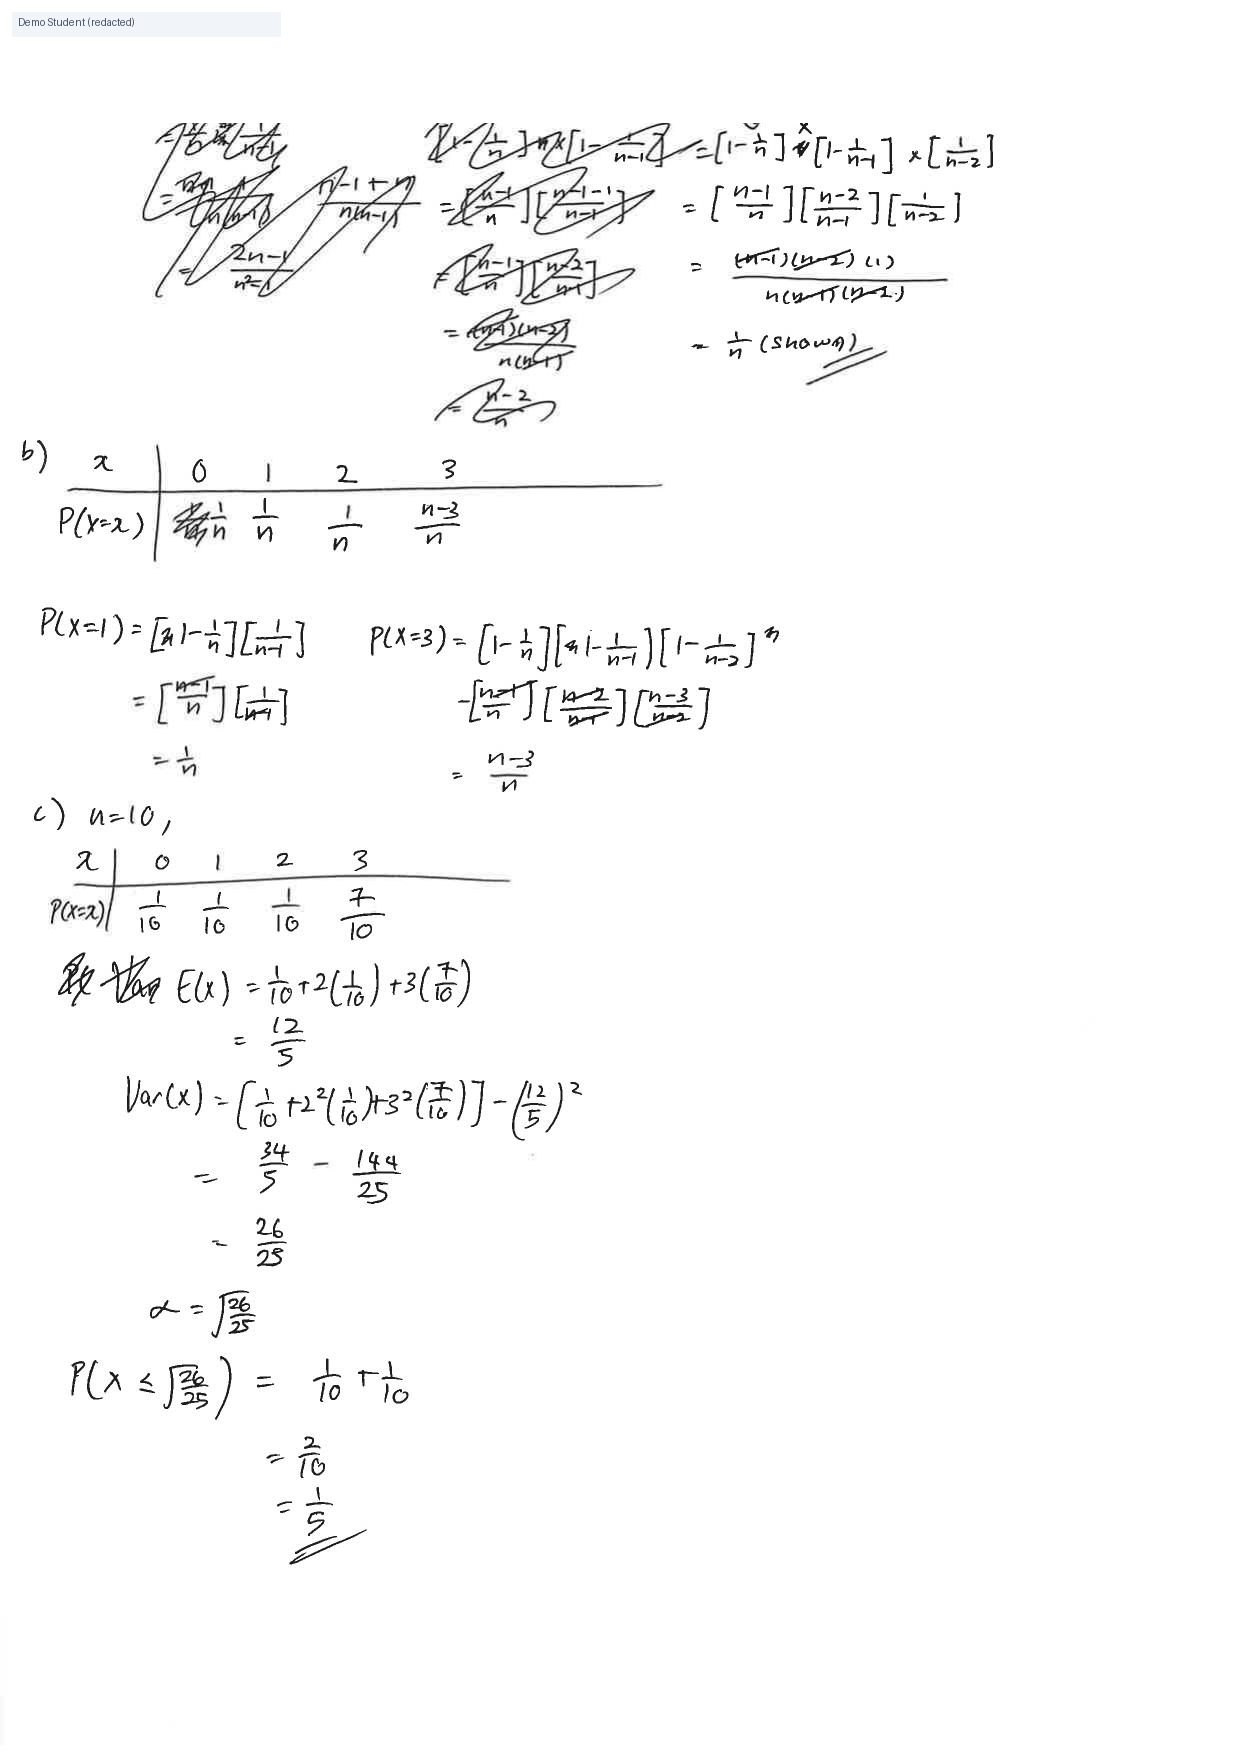
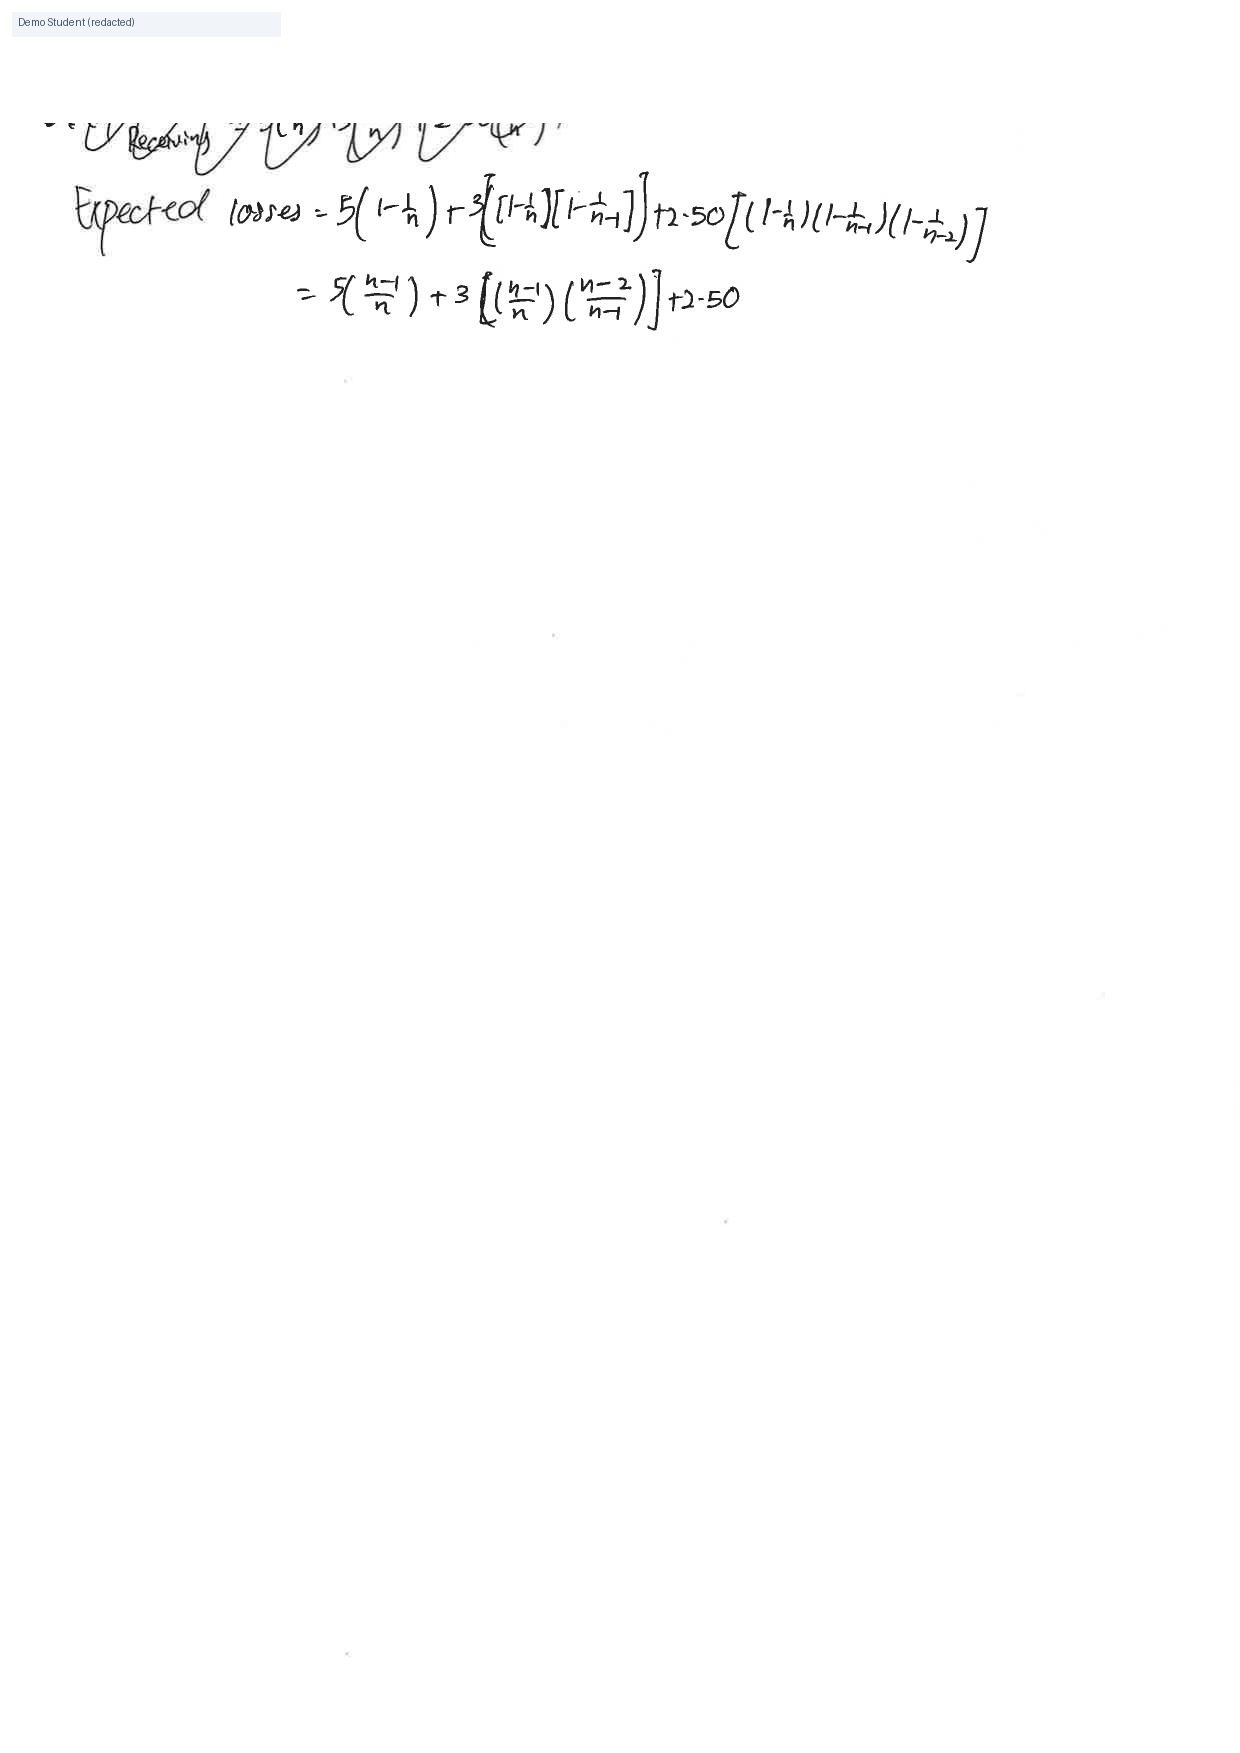
Q7(d) incomplete
This expectation setup is incomplete and does not use the doll cost $10. The break-even value is n = 16.
expected losses
What to do next: Let Y be Happie's amount (or profit) per game, include the $10 cost, set E(Y)-10=0 (or E(profit)=0), solve n=16.
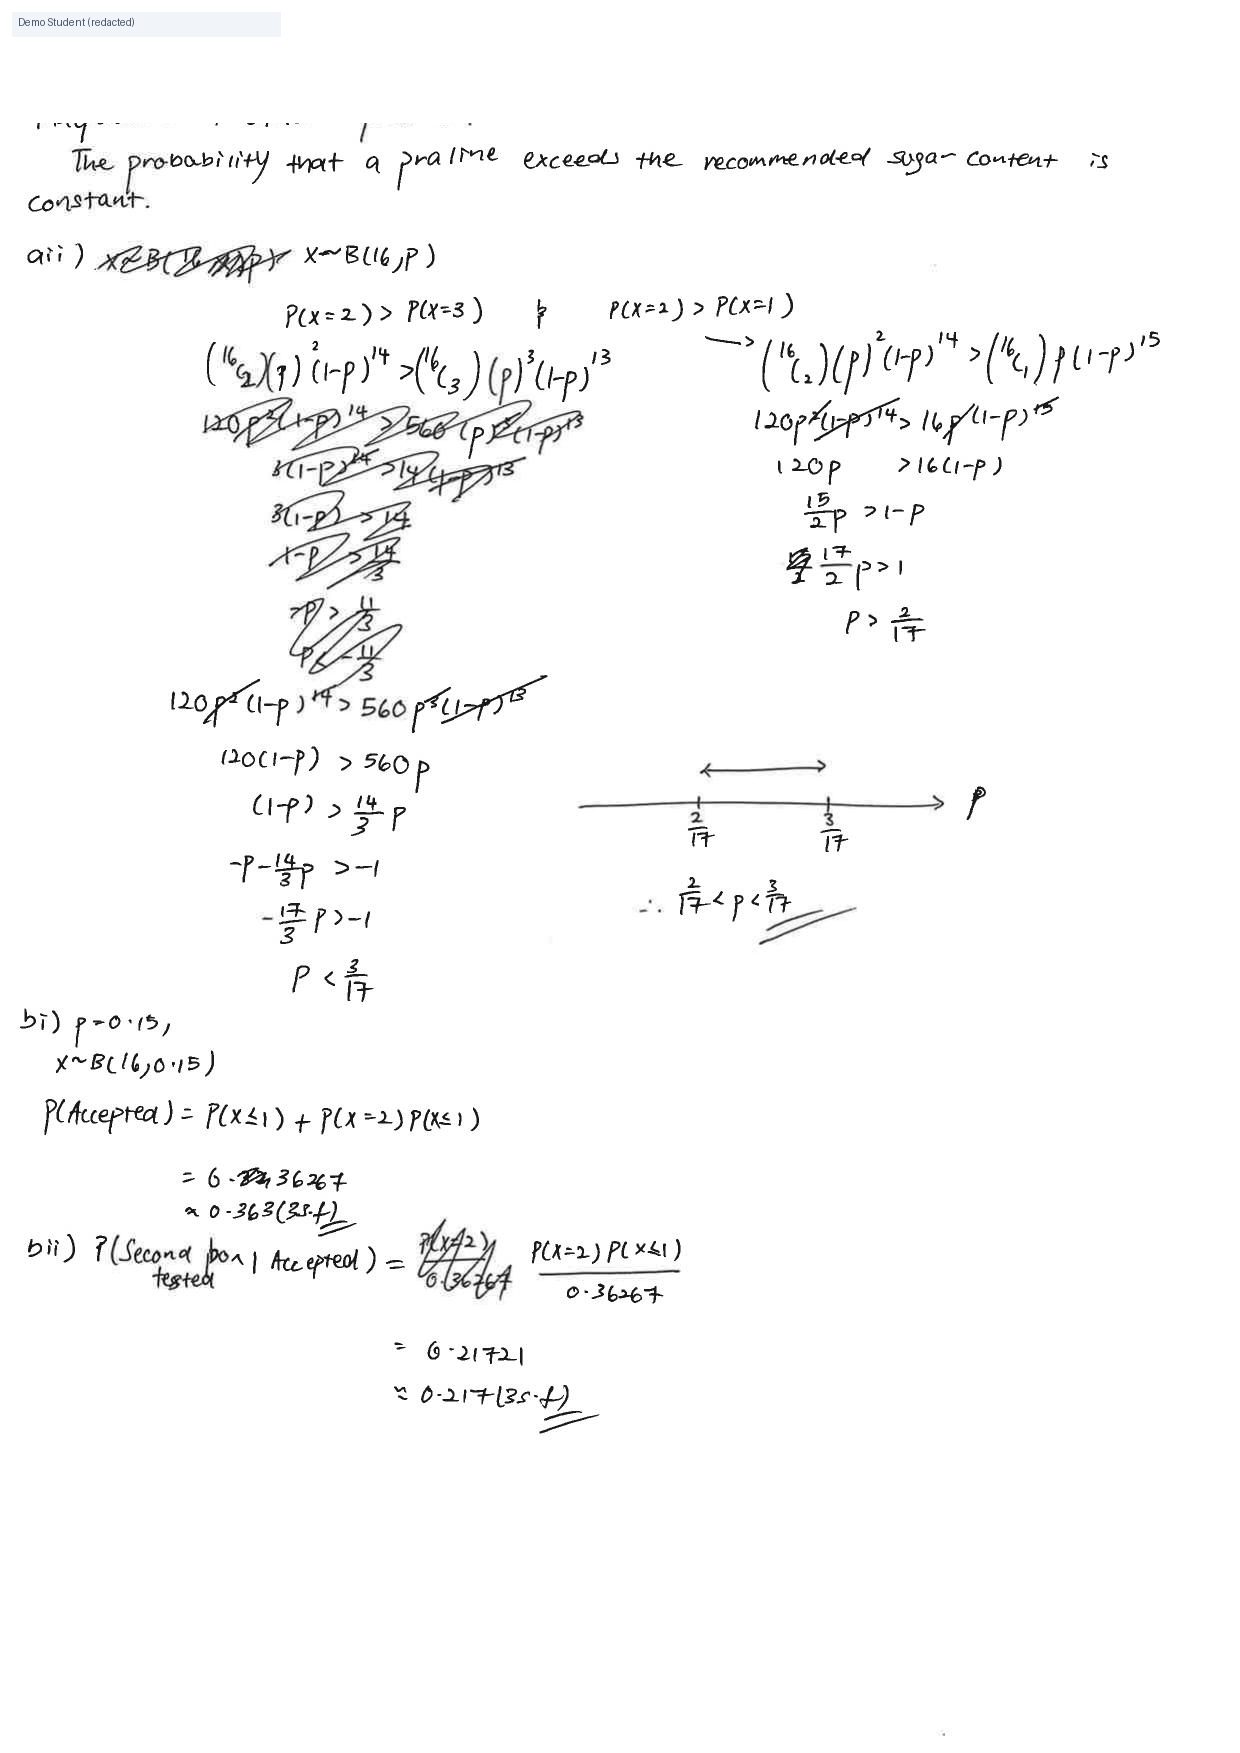
Q8(a)(i) independence
Correct independence assumption in context.
independent
Q8(a)(i) constant p
Correct constant probability assumption.
constant
Q8(a)(ii) range for p
Correct exact range for p.
Q8(b)(i) acceptance probability
Correct. P(accepted) ≈ 0.363.
0.363
Q8(b)(ii) conditional probability
Correct. Conditional probability ≈ 0.217.
0.217

No comments on this page.
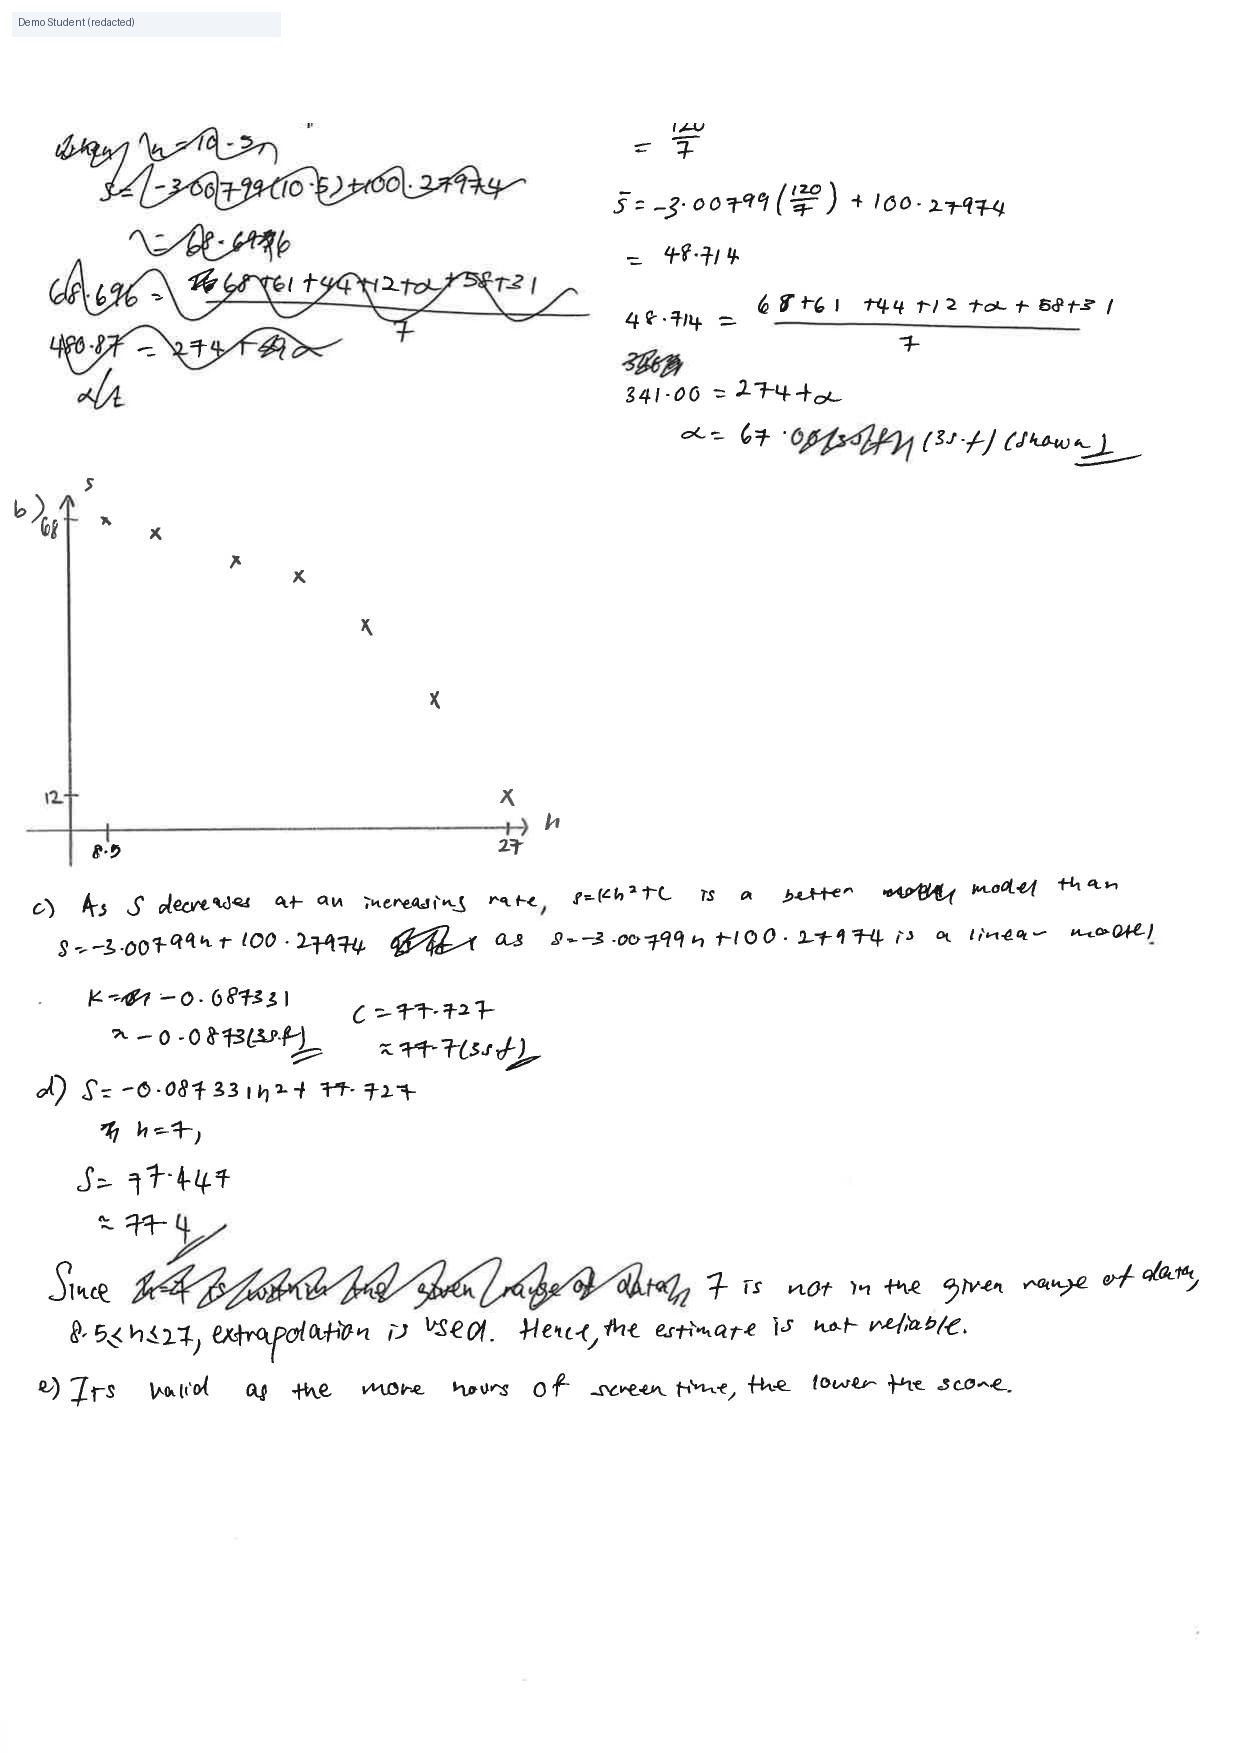
Q9(a) alpha
Correct. using the mean point on the regression line.
67.0
Q9(b) scatter diagram
Clear scatter diagram with a decreasing trend.
scatter
Q9(c) k and c
Correct values of k and c for the better model.
k,c
Q9(d) calculation error
With and , , not .
77.4
What to do next: Recalculate -0.0873 × 49 + 77.7 carefully.
Q9(d) reliability
Good. You correctly noted that h = 7 is outside the data range, so the estimate is not reliable.
extrapolation
Q9(e) causation
Correlation is not causation. The statement is not valid; other factors may explain the trend.
said valid
What to do next: Say correlation does not imply causation.

No comments on this page.
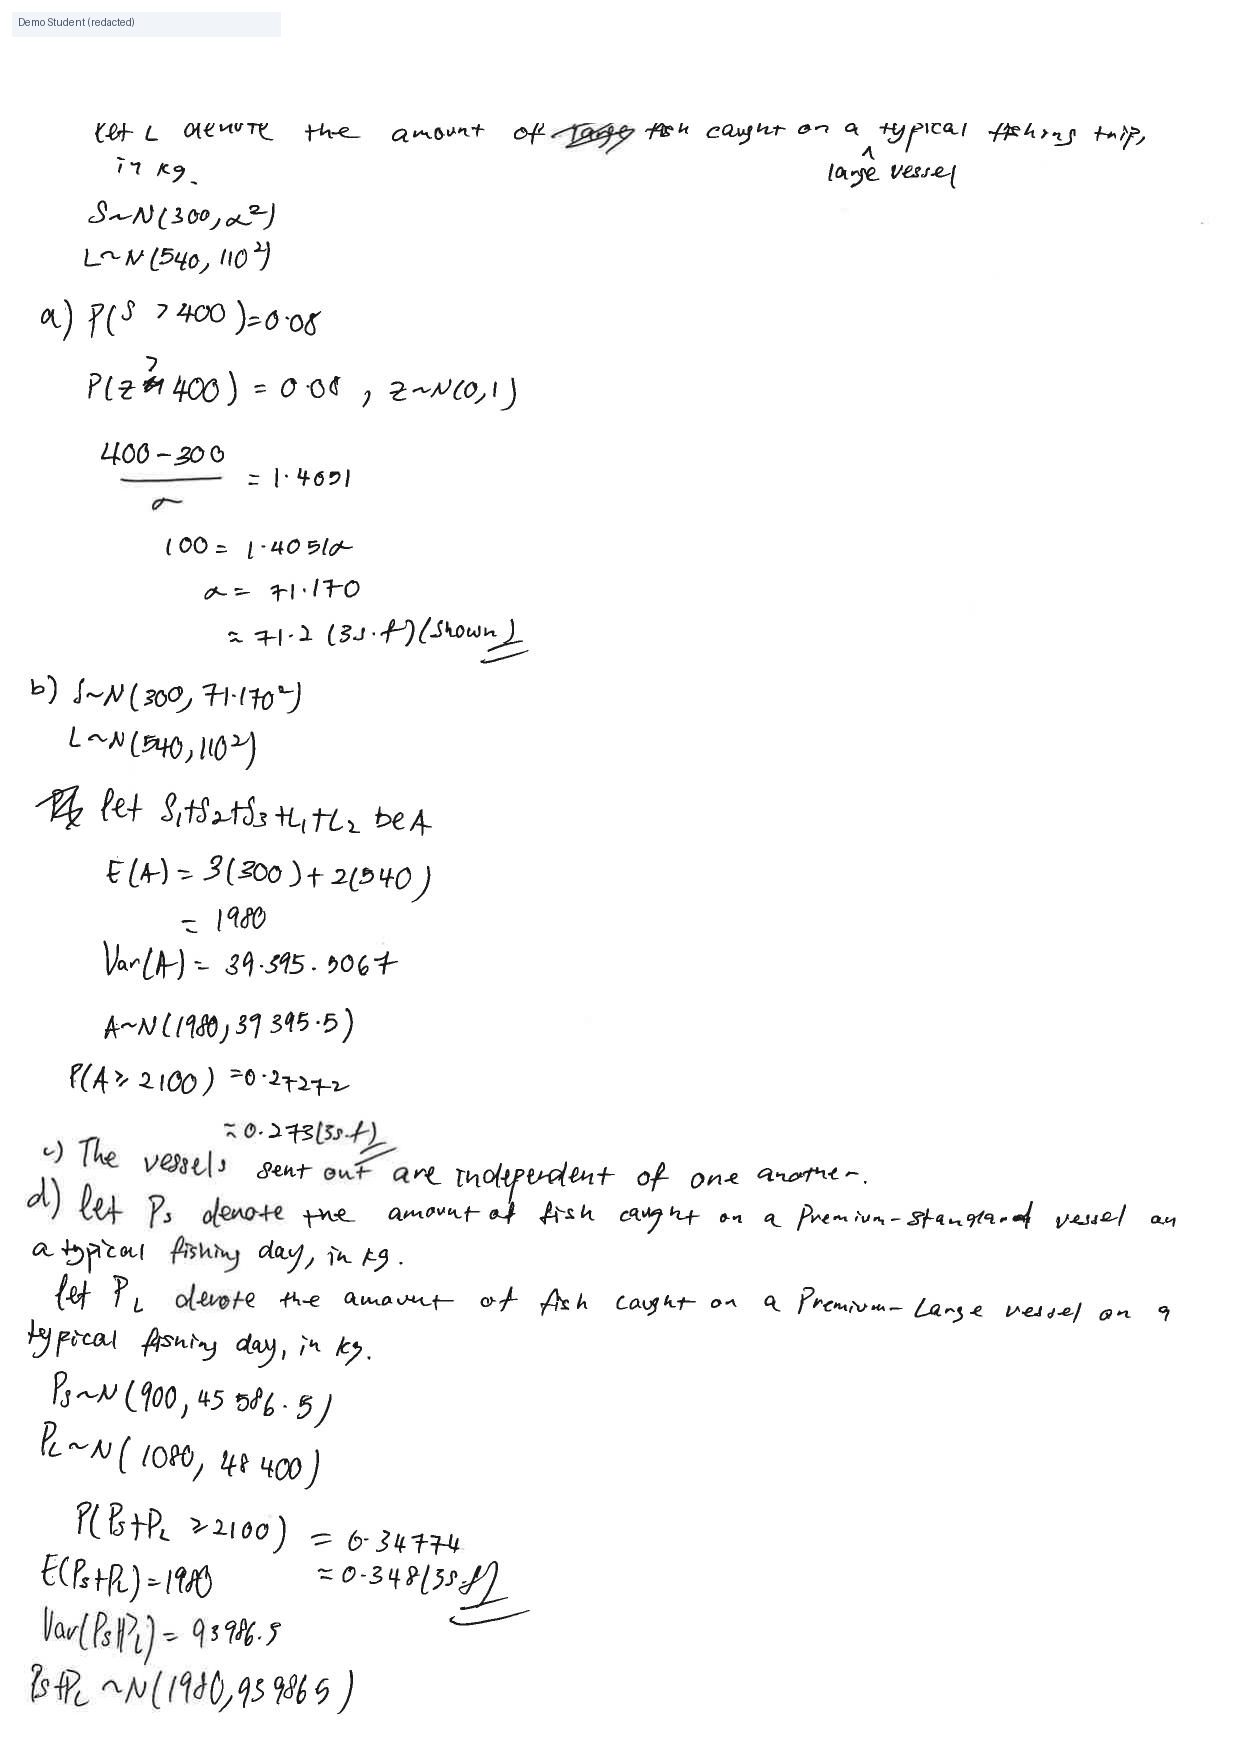
Q10(a) sigma
Correct standardisation and σ ≈ 71.2.
71.2
Q10(b) probability
Correct. Using gives about .
0.273
Q10(c) assumption wording
Say the amounts of fish caught by the vessels are independent of one another (not just that the vessels are independent).
vessels independent
What to do next: State independence of the catch amounts S1,S2,S3,L1,L2.
Q10(d) probability
Correct. Premium vessels give about 0.348.
0.348
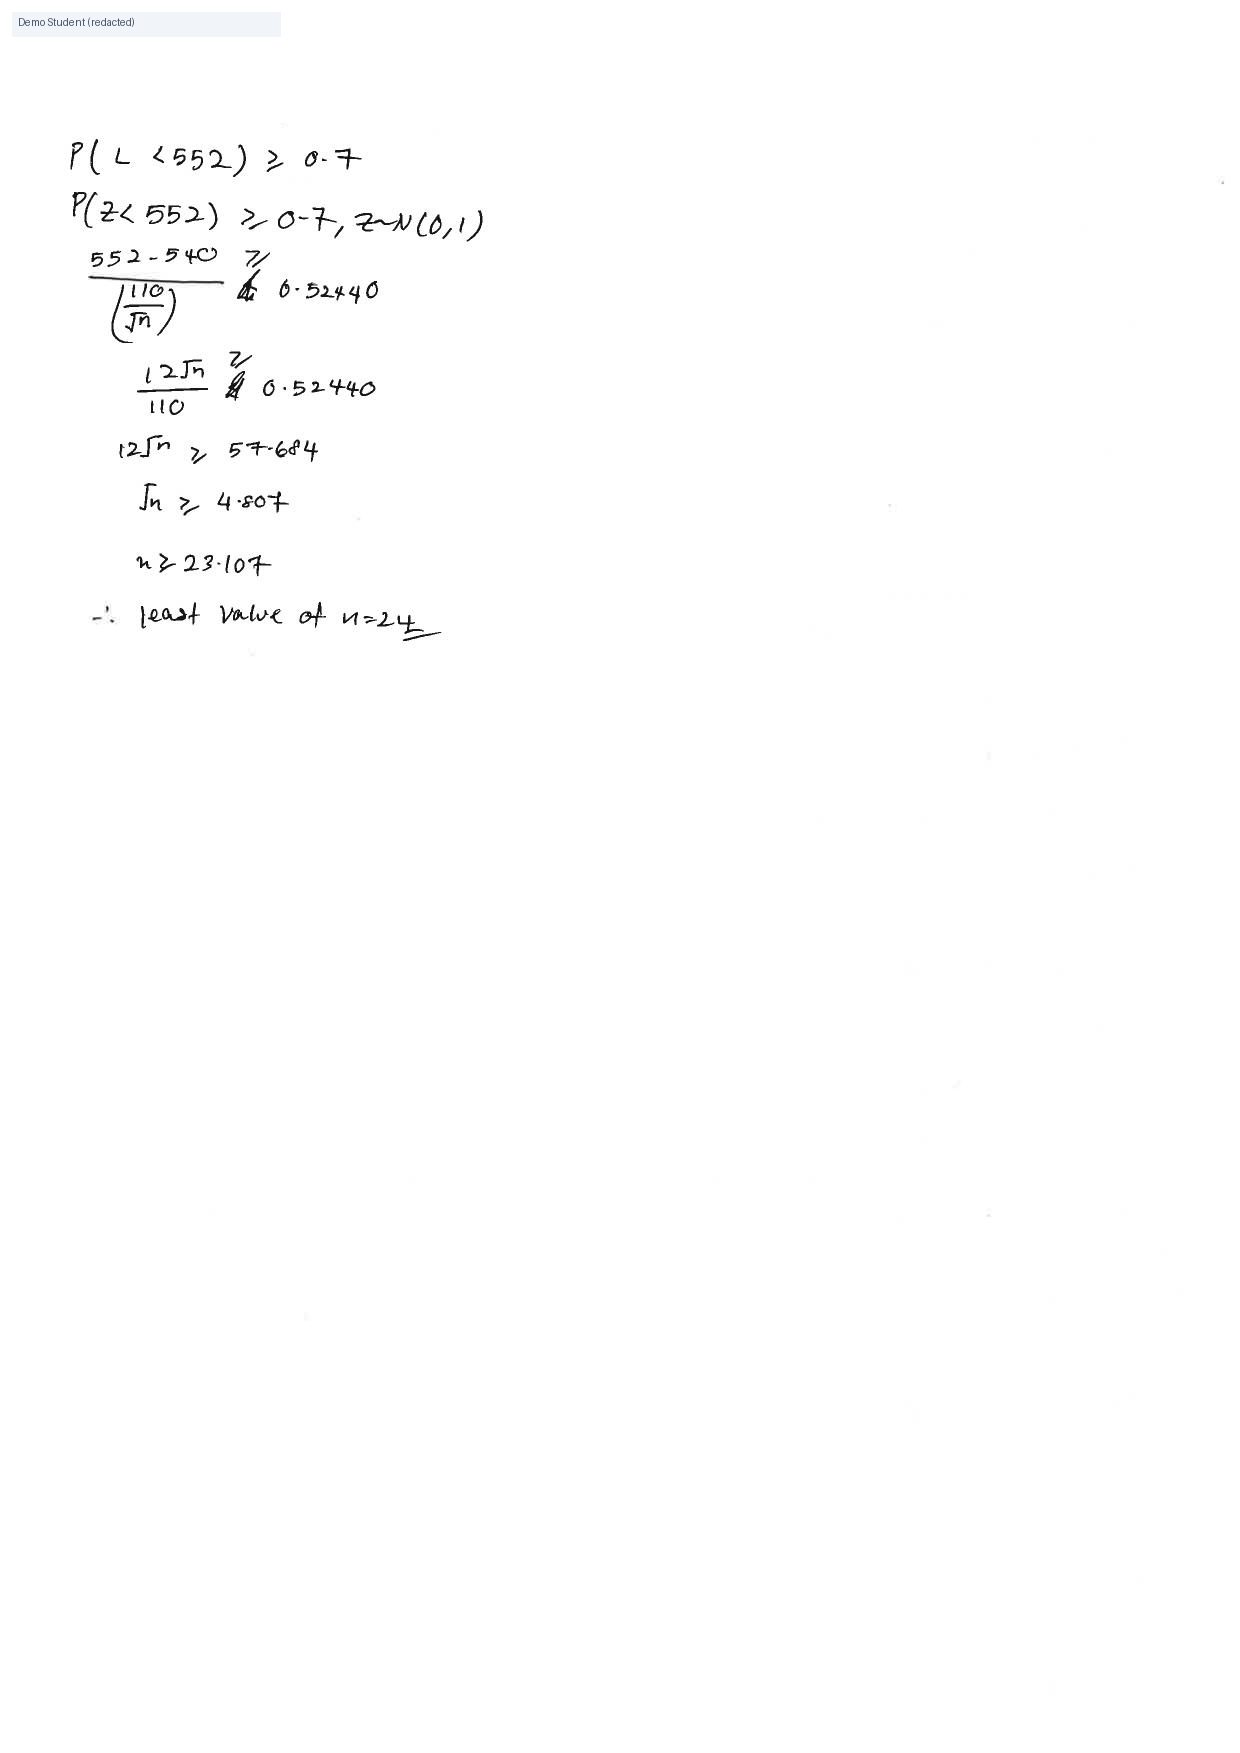
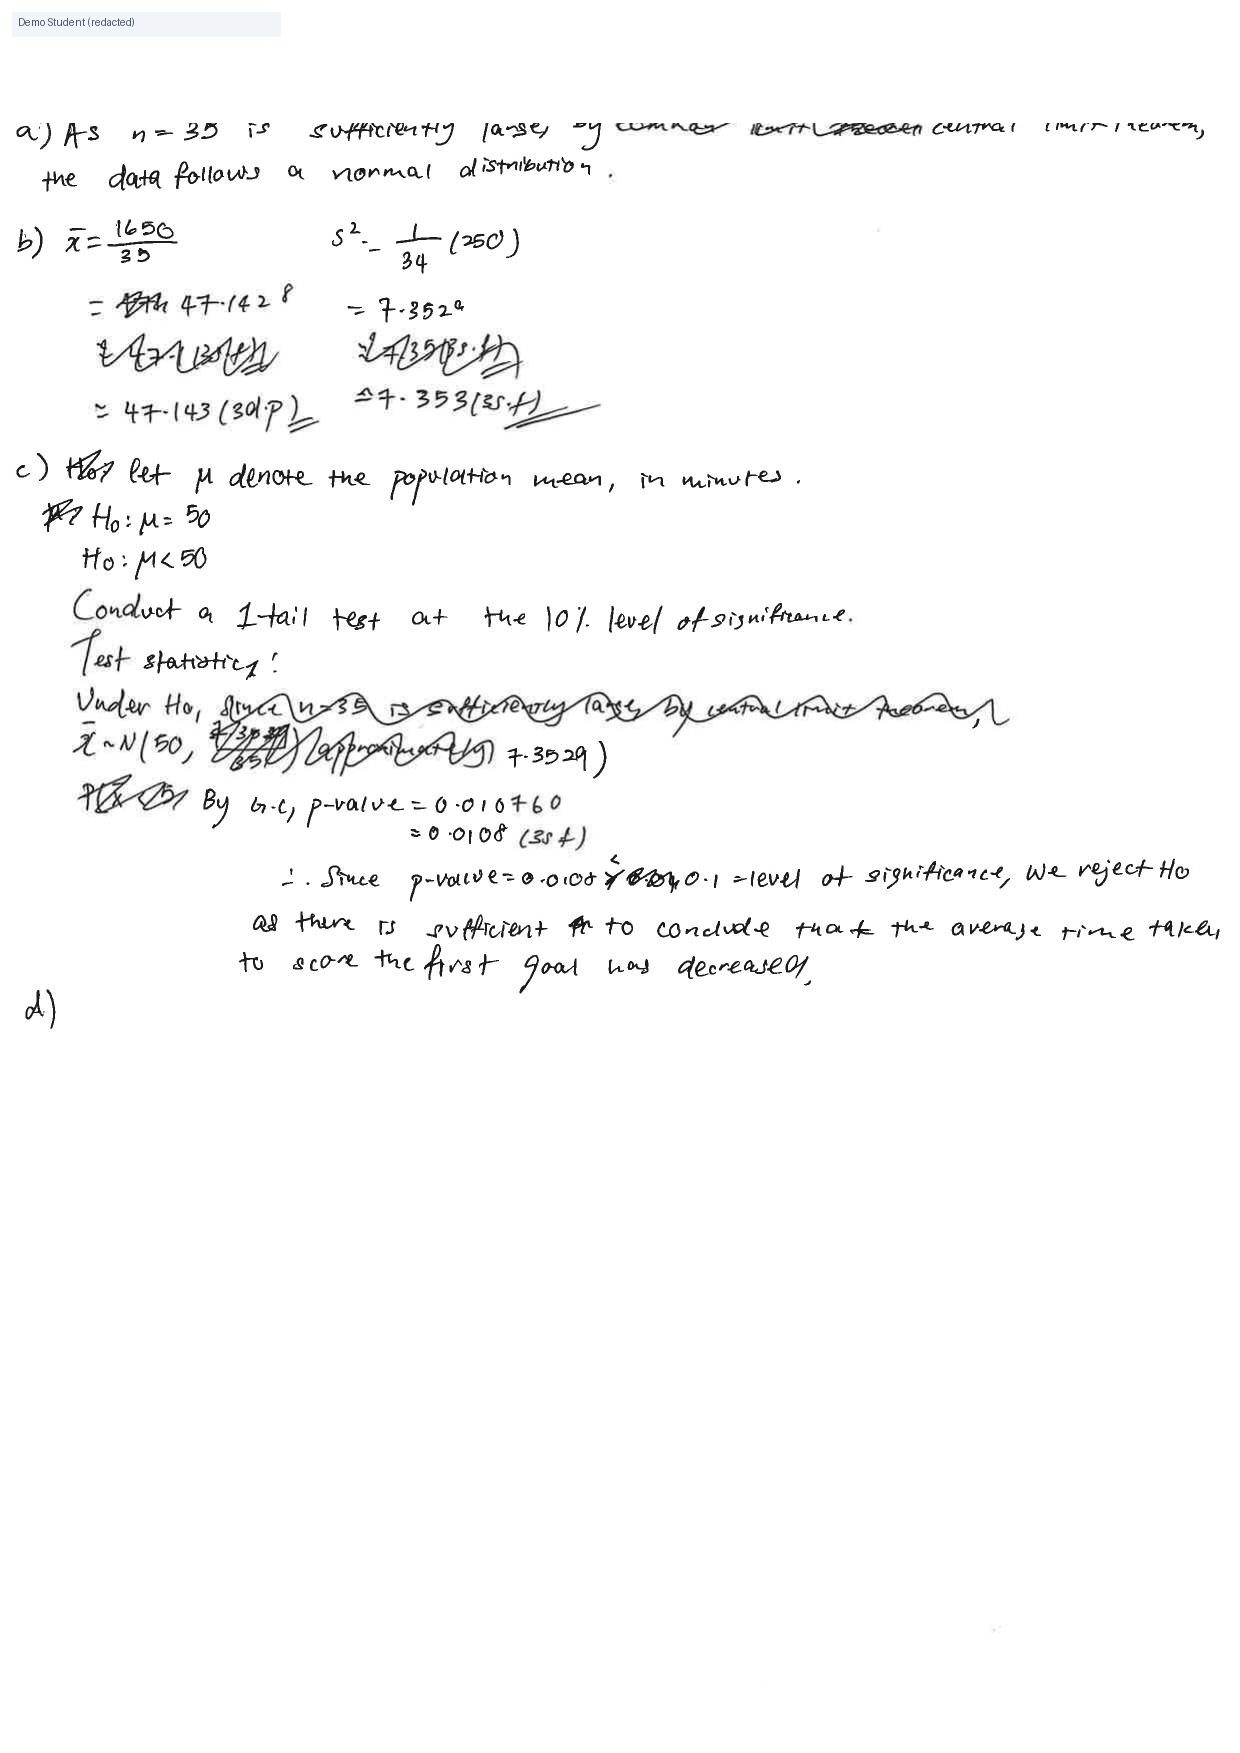
Q11(a) wording
It is the sample mean (not the raw data) that is approximately normal by CLT, because n = 35 is large.
data follows normal
What to do next: Say: sample mean approx normal by CLT since n is large.
Q11(b) variance
250 is the sample variance. Unbiased estimate is (3 d.p.), not .
7.353
What to do next: Use (sample variance).
Q11(b) mean
Correct unbiased mean 47.143 (3 d.p.).
47.143
Q11(c) hypotheses
Correct hypotheses for a decrease in mean time.
H1: μ<50
Q11(c) p-value and conclusion
With the correct variance 257.353, p-value ≈ 0.146 > 0.1, so do not reject H0. There is insufficient evidence that the mean time has decreased.
reject H0
What to do next: Redo the test with ; conclude do not reject .
Q11(d) missing
Q11(d) is blank. For the two-tailed 10% test, reject when y < 36.1 or y > 43.9.
blank d
What to do next: Use H0: μ=40 vs H1: μ≠40, critical z = ±1.6449.

No comments on this page.
Q1(a) key features
Good. You labelled (3,4), (2,0) and the asymptote x=1 on the right-hand side.
(3,4), x=1